Information Technology Reference
In-Depth Information
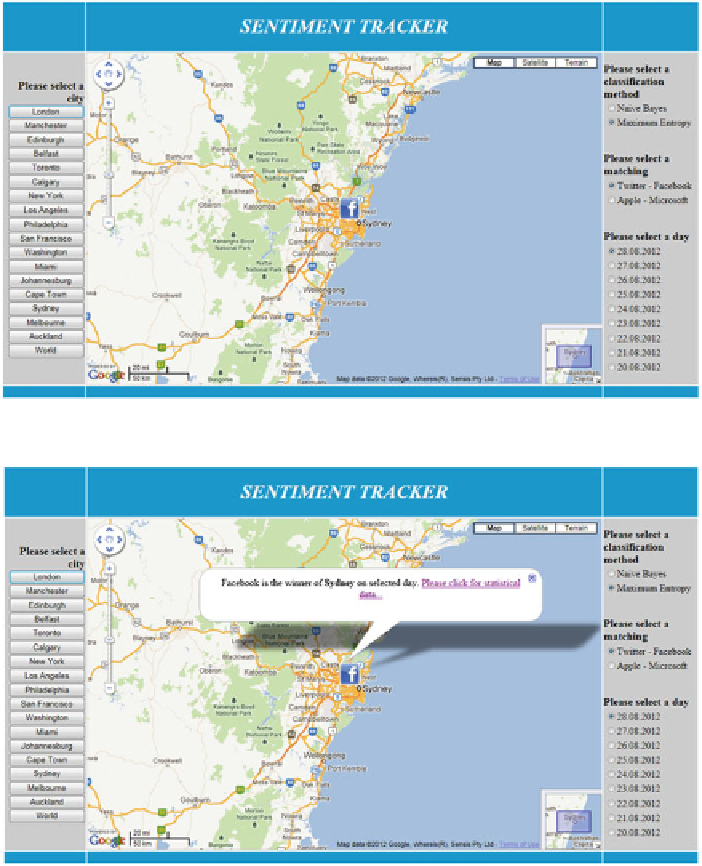
Fig. 2.7
Screen shot of the main page after selecting the city of Sydney
Fig. 2.8
Screen shot of the main page after clicking on a brand logo
can select the cities in order to monitor the winner brand. Users can also choose the
classification method, brand matching, and the day on the right side of the web page.
If user clicks on the brand logo, a bubble appears as it can be seen from the Fig.
2.8
.
By following the link, the user can monitor the statistical charts related to cities and
brands.
Search WWH ::

Custom Search