Information Technology Reference
In-Depth Information
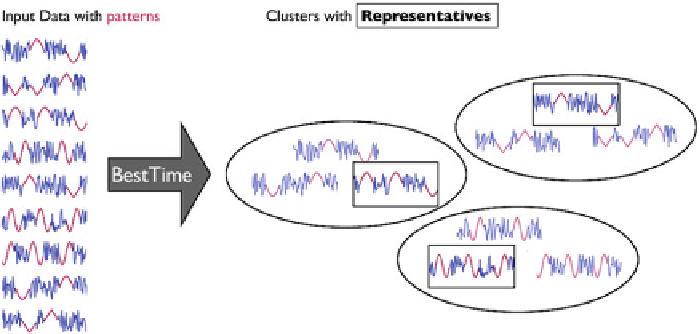
Fig. 12.8
Given a set of time series with previously unknown patterns, we aim to cluster the data
and find a representative (highlighted) for each group
Minimum Number of Observations. Depending on the application, the user can
optionally reduce the size of the dataset by specifying the minimum length of the
time series which should be consider for further processing.
Data Reduction Rate. Since the computational complexity of our distance calcu-
lations is quadratic in the length of the time series, we offer the possibility to
reduce the length via piecewise aggregate approximation [
4
]. Given a time series
of length
n
and a reduction rate
r
, the approximate time series is of length
n
r
.
Minimum Pattern Length. As described in Sect.
12.9
, the predeterminedminimum
pattern length
l
min
directly influences the time series similarity. This parameter
strongly depends on the application and needs to be chosen by a domain expert.
Variable Selection. In case of time series datasets with multiple dimensions, the
user interface of our tool offers the possibility to select the variables that should
be considered for further analysis.
Similarity Threshold. This parameter is usually very sensitive and directly influ-
ences the clustering result. Since it may be challenging to determine an appropri-
ate similarity threshold
/
for each variable, our tool can alternatively recommend
(estimated) thresholds.
Parallel Computing. Calculating the distance matrix is costly for large datasets.
However, this step is fully parallelized and runs almost
n
CPU
-times faster than
serial processing. Up to 12 parallel workers are supported.
Quality Control. Our tool presents a colored plot of the computed distance matrix
and a histogram of the distance distribution in order to ensure appropriate parame-
ter settings as well as clusters that preserve the time series characteristics. Since
both plots are updated iteratively during distance calculations, we can abort com-
putation anytime the preview suggests undesired results. For the distance matrix,
a high variance in the distances/colors indicates an appropriate parameter setting,
and a low variance in the distances/colors may result in poor clustering. In general,
Search WWH ::

Custom Search