Information Technology Reference
In-Depth Information
(a)
ABCD
A
B
C
D
DCBA
D
C
B
A
A**D
A
D
*BC*
B
C
(b)
DCBA
A**D
(c)
ABCD
ABCD
A**D
DCBA
*BC*
A**D
DCBA
*BC*
19
19.5
20
0.75 0.8 0.85 0.9 0.95
RRR
DTW
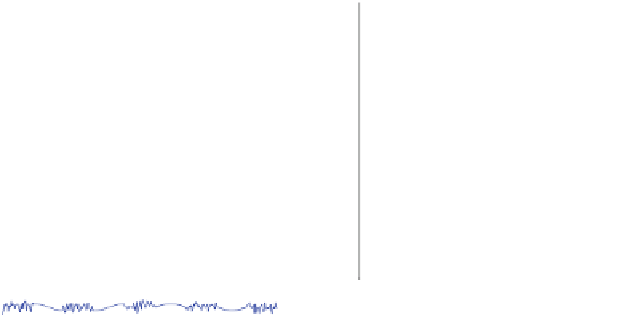
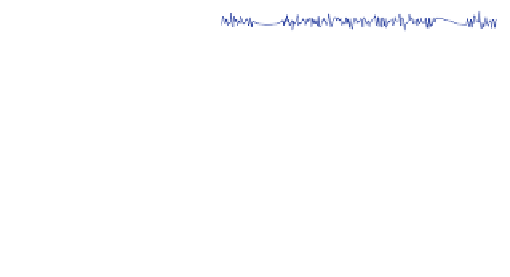
Fig. 12.2 a
Sample dataset of normally distributed pseudorandom time series (named as ABCD,
DCBA, A**D and *BC*, illustrated
left
) with artificially implanted sinus patterns (labeled as A-D,
presented in their occurring order on the
right
).
b
Cross Recurrence Plot (CRP) of synthetic time
series ABCD and DCBA (
left
)aswellasABCDandA**D(
right
) introduced in
a
. Note that
the main diagonal runs from
upper left
to
bottom right
.
c
Agglomerative hierarchical cluster tree
(dendrogram) of synthetic time series data (introduced in
a
) according to the DTW distance (
left
)
and our proposed RRR distance (
right
), where the x-axis reveals the distance between the time
series being merged and the y-axis illustrates the corresponding name and shape of the signal


Search WWH ::

Custom Search