Information Technology Reference
In-Depth Information
140
(a)
120
100
80
60
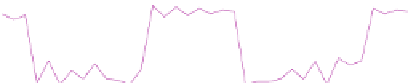
dfcghGATHERSPEEDlmknhDECELERATEghfkd
rsqtpACCELERATORxywzvBRAKEPEDALtvswr
140
120
100
80
60
kdhfSLOWDOWNglbkchdgfGATHERSPEEDnkml
tpsBRAKEPEDALzrysxtwvACCELERATORxtwv
(b)
kdhfSLOWDOWNglbkchdgfGATHERSPEEDnkml
tpsBRAKEPEDALzrysxtwvACCELERATORxtwv
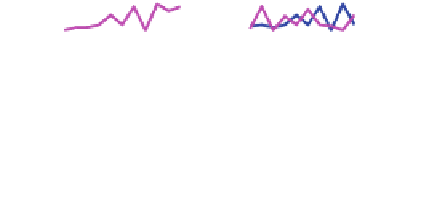
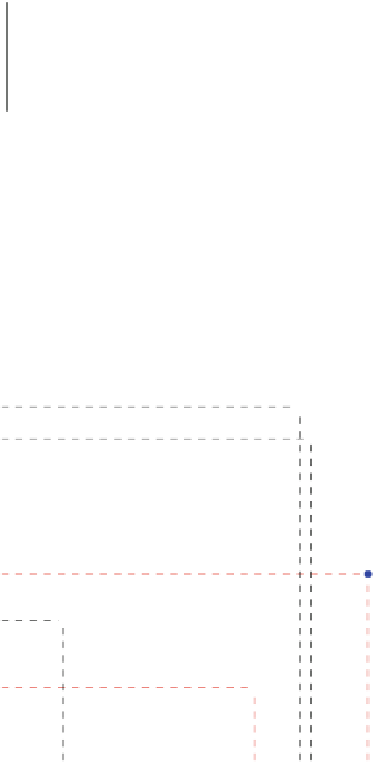
Fig. 12.1 a
ASCii decimal encoding of two multivariate time series
x
and
y
which contain the
same pattern or string sequence at different positions in time.
b
Joint cross recurrence plot (JCRP)
of time series
x
and
y
, introduced in
a
, with
=
0. The diagonal line structure in the recurrence plot
indicates the existence and position of a co-occurring multivariate pattern. The single recurrence
points can be considered as noise
12.5 Recurrence Quantification
Recurrence quantification analysis (RQA) is used to quantify the structures observed
in recurrence plots [
21
]. RQA is grounded in theory, but possesses statistical utility
in dissecting and diagnosing nonlinear dynamic systems across multiple fields of
science [
38
]. The explicit mathematical definition to distinct features in recurrence


Search WWH ::

Custom Search