Information Technology Reference
In-Depth Information
(a)
Monday
Tuesday
Wednesday
Thursday
Friday
Saturday
Sunday
2
4
6
8
10
12
14
16
18
20
22
24
Time of Day
Monday
Tuesday
Wednesday
Thursday
Friday
Saturday
Sunday
(b)
2
4
6
8
10
12
14
16
18
20
22
24
Time of Day
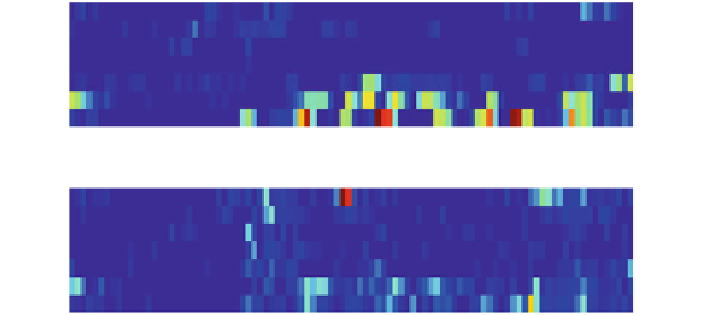
Fig. 10.3
Observed and estimated on/off states for the Washer/Dryer in House 1 over the period
of 4 weeks, illustrating the actual and predicted device activities in the time from April 25 to May
15 2011, where every quarter of an hour aggregates the activities that occurred during the same
weekday and time of day. The transition from
blue
,to
yellow
,to
red
colored areas illustrates low,
moderate, and high device activity.
a
Observed
on
/
off
states of Washer/Dryer.
b
Estimated
on
/
off
states of Washer/Dryer
Table 10.3
Confusion matrix of observed and estimated
on
/
off
device states for theWasher/Dryer
in House 1, where Accuracy
=
TP
+
TN
=
96
.
83%.
Observed
on
Observed
off
True positive (TP)
=
0
.
59%
False positive (FP)
=
1
.
14%
Estimated on
Estimated
off
Falsenegative(FN)
=
2
.
03%
True negative (TN)
=
96
.
24%
showninFig.
10.2
e, f respectively, we can see there is a significant overlap of changes
in power consumption that are caused by both the Refrigerator and other devices.
According to Fig.
10.2
e, f, changes in power consumption that range from around
1-50W occur at times when the refrigerator is turned
on
as well as when its is turned
off
, leading to an inaccurate appliance model.
In order to decrease the number of FP and FN device states one could orchestrate
the trained appliance models or consider additional features that distinguish the
appliances more accurate. However, this goes beyond the scope of this study, but
could be part of future work.
A more thorough evaluation of the heating schedules would require datasets that
comprise information about actual occupancy states in the residential homes and
preferences of the residents in regard of temperature settings.


Search WWH ::

Custom Search