Information Technology Reference
In-Depth Information
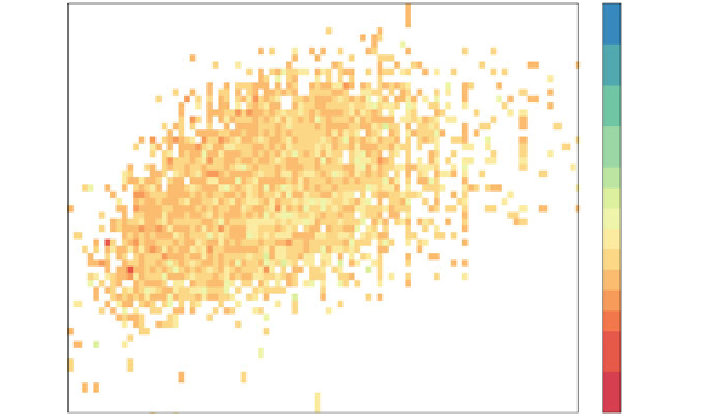
Customers' Age, Height, and Weight
100 years
90 years
200
80 years
70 years
190
60 years
55 years
180
50 years
45 years
40 years
35 years
170
30 years
25 years
20 years
160
10 years
0 years
60
80
100
120
[weight] kg
Fig. 8.6
Customer characteristics. The plot shows the relations between customers' weight (x-axis),
height (y-axis), and age (encoded as color scheme, see
right-hand side
)
32x32
32x33
32x34
34x34
34x33
34x32
34x36
32x30
32x36
32x31
36x34
30x32
36x36
32x38
30x30
32x29
34x38
30x33
36x33
34x31
30x34
30x31
30x36
36x38
34x30
30x29
36x32
32x40
30x38
34x40
36x40
34x29
30x40
32x28
33x32
36x31
30x28
33x33
36x30
0.00
0.02
0.04
0.06
0.08
0.10
0.12
Fig. 8.7
Distribution of trousers sizes. The figure shows the relative frequency of individual trousers
sizes


Search WWH ::

Custom Search