Information Technology Reference
In-Depth Information
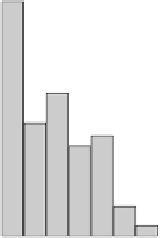
Number of Items per Order
30
20
10
0
0
10
20
30
40
Fig. 8.2
Distribution of items contained in orders. A majority of orders contains 1-12 items
8.4.1.1 Transaction-Related Features
This kind of feature captures information on the transactions. Thus, these features
represent the densest part of the data. Each transaction carries a referring identi-
fier. Orders may comprise several transactions as customers receive outfits rather
than individual clothes. Figure
8.2
illustrates the distribution of items per order. We
observe that a majority of orders comprise up to 12 items. Additionally, transaction-
related data include references to the article, the order date, and whether the article
has been returned or not. The references to individual articles let us analyze their
popularities. We analyze how often transactions include each article. We observe that
the frequencies follow a
Power-Law
distributions. A rather large subset of transac-
tions include a small set of popular articles. Conversely, a majority of articles rarely
appears in transactions. Each transactions entails a timestamp. Thus, we can see
temporal trends. The popularity bias occurs consistently over time.
8.4.1.2 Type-Related Features
As Sect.
8.5.1
illustrates, clothes include a variety of items. Type-related features
enable us to distinguish different types of items. The type information captures dif-
ferent levels of abstraction. The first level differentiates accessories (
≈
10%), apparel
(
8%). Another type refers to the dedicated gender. All items
target male customers which relates to the business idea of the underlying service.
Further, a feature provides type information for accessories and shoes. These cate-
gories include bags, belts, boots, shoe care, and more. Two additional features extend
these categories to further include jeans, blazers, suits, and more. Individual articles
may be assigned to several categories. For instance, the system assigns a belt to both
accessories, belts, and targeting men. Figure
8.3
displays the distribution of instances
of type III. We notice that tops and trousers account for the majority of transactions.
≈
83%), and footwear (
≈


Search WWH ::

Custom Search