Global Positioning System Reference
In-Depth Information
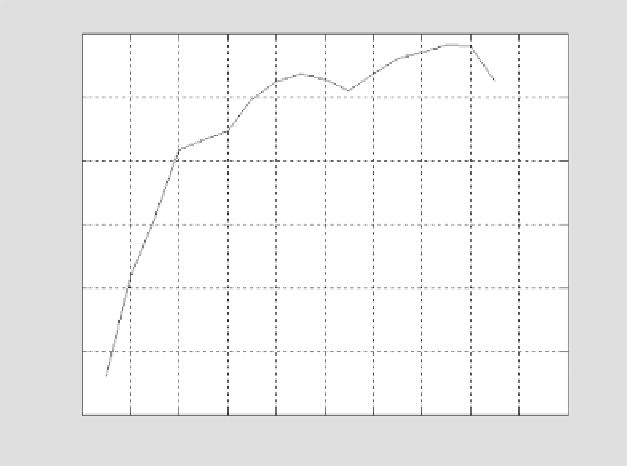
The next test is using 5 MHz as the sampling rate to evaluate the bandwidth
effect of digital filter. The approach is to decimate the digitally filtered data by
2. In other words, the 10-MHz sampled input data are decimated by 2, and then
digitally filtered. The same acquisition method is used. The results are shown in
Figure 12.23. When there is no filter (2.1 MHz), the detection
S
/
N
is less than
21 dB. This value is lower than 21.5 dB, the corresponding point in Figure 12.22.
It is believed that this difference is caused by the noise distribution. The noise
bandwidth is more than 2.5 MHz and folds into the receiver. Since 5 MHz is
the regularly used sampling frequency in the software receiver, the results in
Figure 12.23 can be used to evaluate the effect of the filter bandwidth.
Figure 12.23 shows that when the filter bandwidth is reduced to 1 MHz,
the postdetection
S
/
N
is decreased by less than 1 dB, compared with a 2 MHz
bandwidth. From this simple illustration, one can expect that a lower sampling
frequency can be used and the receiver sensitivity will not decrease significantly.
For example, if a 1-MHz analog filter is used instead of the present 2 MHz, the
receiver might decrease by about 1 dB. With this filter bandwidth, however, the
sampling frequency can be reduced to about 2.5 to 3 MHz. Although the low
sampling rate can further decrease the receiver sensitivity slightly, it can reduce
the computation burden. However, the receiver sensitivity is not the only concern.
When a receiver has a narrow band, the correlation peak is rounded off, and this
can affect the accuracy of the pseudorange measurements. If a narrow band filter
and lower sampling frequency is desirable, further study is needed.
With the improvement in computer operation speed, it appears that 5 MHz
sampling rate is a satisfactory value to operate in real time, and there is no need
Filter bandwidth versus output with f
s
=
5 MHz
21
nf
20.5
20
19.5
19
18.5
18
0.4
0.6
0.8
1
1.2
1.4
1.6
1.8
2
2.2
2.4
Filter bandwidth in MHz
FIGURE 12.23
Detection
S
/
N
versus filter bandwidth with 5-MHz sampling rate.
Search WWH ::

Custom Search