Global Positioning System Reference
In-Depth Information
4000
3000
2000
1000
0
−
1000
2000
−
−
3000
−
4000
0 0 0 0 0 0 0 0 0 0 0
Sort index
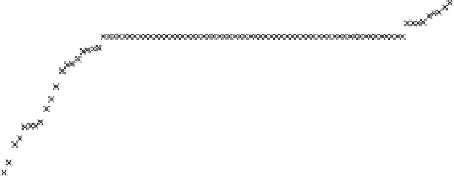
FIGURE 12.13
Sorted difference of initial phase of C/A code.
center portion are the desired ones, as shown in Figure 12.14. This figure can be
considered a magnified version of Figure 12.13.
In Figure 12.14, because in the acquisition for the coherent integration the
data are shifted 2 samples, the time resolution for the initial C/A code can
be considered as 2 sampling points. Because the resolution is 2 samples, the
measured initial C/A code change is either
−
6 samples or
−
8 samples every
20 ms. This is why the differences of initial C/A codes are divided into two
groups:
−
8and
−
6 in Figure 12.14. By arbitrarily using 25 points of the center
portions of Figure 12.14 to avoid the erroneous difference values on the ends, an
average value and a standard deviation can be found from these 25 points. The
average value is close to the slope of the desired line. The standard deviation is
then used as a limit to eliminate erroneous data points. One can draw a straight
line passing through a “valid” initial C/A code data phase by using the average
value as the slope. A valid initial C/A point is a point on the desired line in
Figure 12.11. It can be determined from the difference between initial points. If
the difference initial C/A code value obtained from two adjacent points
n
k
and
n
k
+
1
is very close to the average value, both
n
k
and
n
k
+
1
are valid points. Select
±
50 times of standard deviations as the threshold to eliminate the erroneous
points. The value 50 is obtained from experimenting with the values shown in
Figure 12.11. Figure 12.15 shows the two lines used to limit the “good” points.
These good points are fitted into a straight line, as shown in Figure 12.16. From
this line, one can find two points - the initial C/A codes corresponding to
x
(1)
and
x
(101) - and call them
y
(1) and
y
(101). In this example, although there are


Search WWH ::

Custom Search