Global Positioning System Reference
In-Depth Information
Rayleigh distribution
0.7
0.6
0.5
0.4
0.3
0.2
0.1
0
0
0.5
1
1.5
2
2.5
3
3.5
4
4.5
5
r
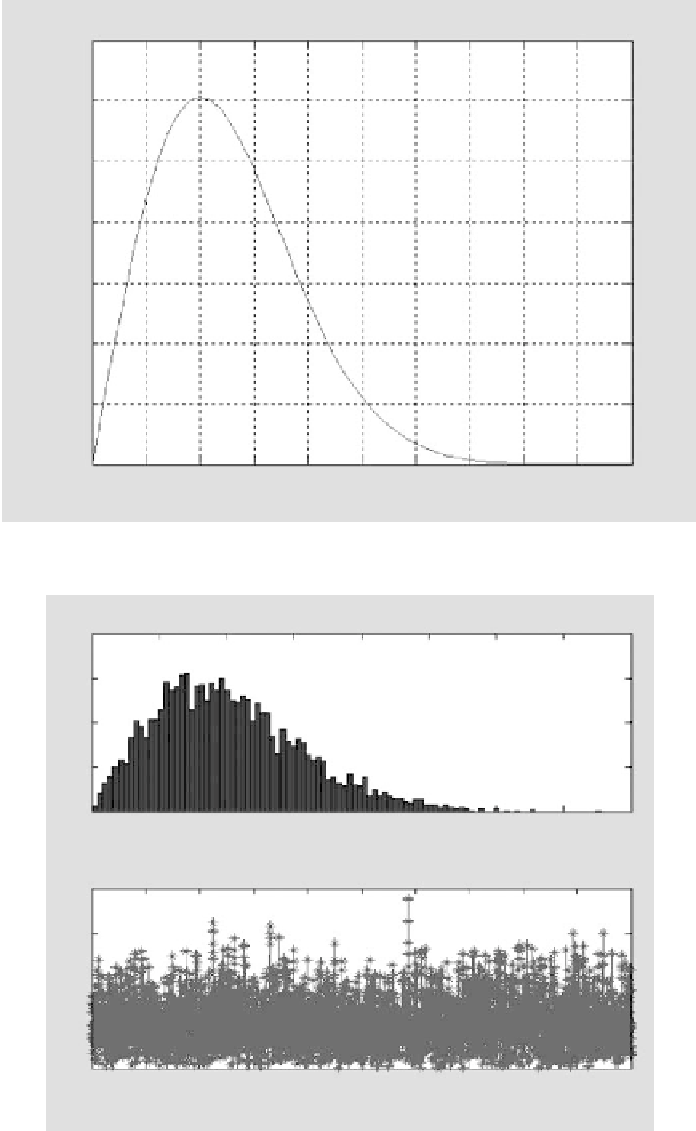
FIGURE 10.13
Rayleigh distribution.
Histogram results from coherent integration
200
150
100
50
0
0
100
200
300
400
(a) Histogram
500
600
700
800
Noise in time domain
800
600
400
200
0
0
500
1000
1500
2000
2500
3000
3500
4000
4500
5000
(b) Time domain output.
FIGURE 10.14
Simulated Gaussian noise through coherent integration.
Search WWH ::

Custom Search