Global Positioning System Reference
In-Depth Information
where
x(n)
is a complex input signal. The input frequency is between frequency
bin
k
and
k
1
)
are the
two desired frequency bins, and they are 180
◦
apart. In the equation above an
approximation can be made if the value of
N
is assumed to be large, such as
1/
N
+
1 and is represented by
k
+
0
.
5. The
X(k)
and
X(k
+
1
/N
2
. For a 5000-point FFT the error is about 9
−
16
, which is negligible.
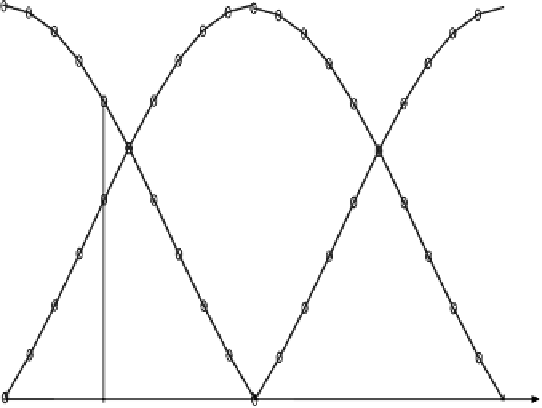
Figure 10.8 shows the frequency domain result of the periodic method dis-
cussed in the previous section. In this figure only 2 kHz of frequency is shown.
One frequency range is from 0 to 1 kHz, labeled filter bank
A
with 100 Hz res-
olution, but not including the 1 kHz frequency bin. The other one is from 1 to
2 kHz, labeled filter bank
B
with 100 Hz resolution, but not including the 2 kHz
frequency bin. The frequency bins in both filters
A
and
B
are labeled from 0
to 9. There are a total of 20 frequency bins in Figure 10.8. In order to cover
±
5 kHz, 100 total frequency bins are required. In this figure the output signal
amplitude is affected by two filters: one filter has a bandwidth of 1 kHz and the
other one has a bandwidth of 100 Hz. The amplitude change between filters
A
and
B
is shown in this figure.
In this discussion, both the wideband and narrow band filters are included, but
the discussion will be concentrated on the wideband filter. Usually the wideband
filter
A
is considered to only cover
±
500 Hz because the adjacent filters cover
frequencies beyond this range. In this discussion the frequency cover is extended
to
±
1,000 Hz. Since in the FFT output there are only positive frequency compo-
nents,
A
−
are used to represent the positive and negative frequencies of
filter
A
. Similar representations
B
+
and
A
+
and
B
−
are used for filter
B
.Thecircleson
Filter bank A
Filter bank B
Output from A4
B
−
A−
A0
B0
Output from B4
A
+
B
+
0123456789012345678
1000
9
2,000
0
Frequency in Hz
FIGURE 10.8
Illustration of two filter banks.


Search WWH ::

Custom Search