Geoscience Reference
In-Depth Information
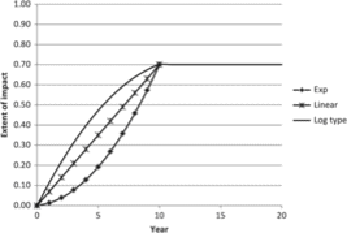
Figure 7.2
Impact trajectory for one habitat/service combination.
Figure 7.2
is drawn under the assumption that the time coding is '10/20', i.e. maximum
provisioning reached at
t
= 10 and then this level persisting until
t
= 20. Other time codes
included
t
= 5,
t
= 8,
t
= 15, and
t
= 20, i.e. 5/20, 8/20, 15/20, 20/20.
This coding was applied for each habitat/service combination for both BAU and MCZ
designation. The BAU was used as a reference point. The with-policy MCZ coding was ap-
assessed two levels of restrictions in terms of access to MCZ designated sites. Under the
higher level of restriction (general presumption against fishing of all kinds and all destruct-
ive and disturbing activities) around 47% of cells were coded as having either a 'high' or
'very high' impact from MCZ designation.
7.3.2.4 Individual value estimates per ecosystem service/habitat type
The impact scoring for MCZ designation allows a biophysical estimation of the additional
provisioning for a typical hectare of the habitat type, measured in terms of current (
t
= 0)
provisioningofthatservice.Thetotalareaundertherespectivecurvein
Figure7.2
provides
thebenefitofMCZapplicationforthishabitat/servicecombination,acrossthe20-yeartime
period. But to determine what this value is in absolute (monetary) terms it is necessary to
determine
t
= 0 provisioning.