Environmental Engineering Reference
In-Depth Information
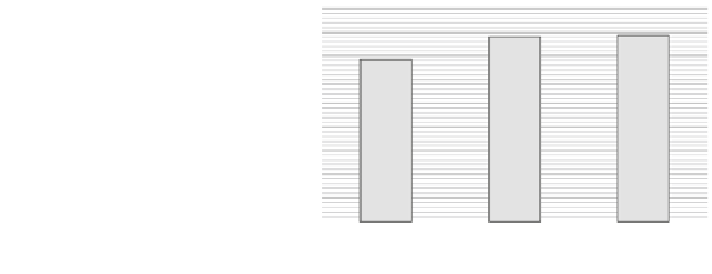
Fig. 18 Boundary length of
three models with V
air
=40m/
s (Amano et al.
2014a
,
b
)
14.00
13.00
±0.61
±0.40
12.00
±0.41
11.00
10.00
9.00
8.00
7.00
6.00
11.85
12.79
12.87
5.00
k-
ʵ
SST k-
ˉ
RSM
Turbulence Models
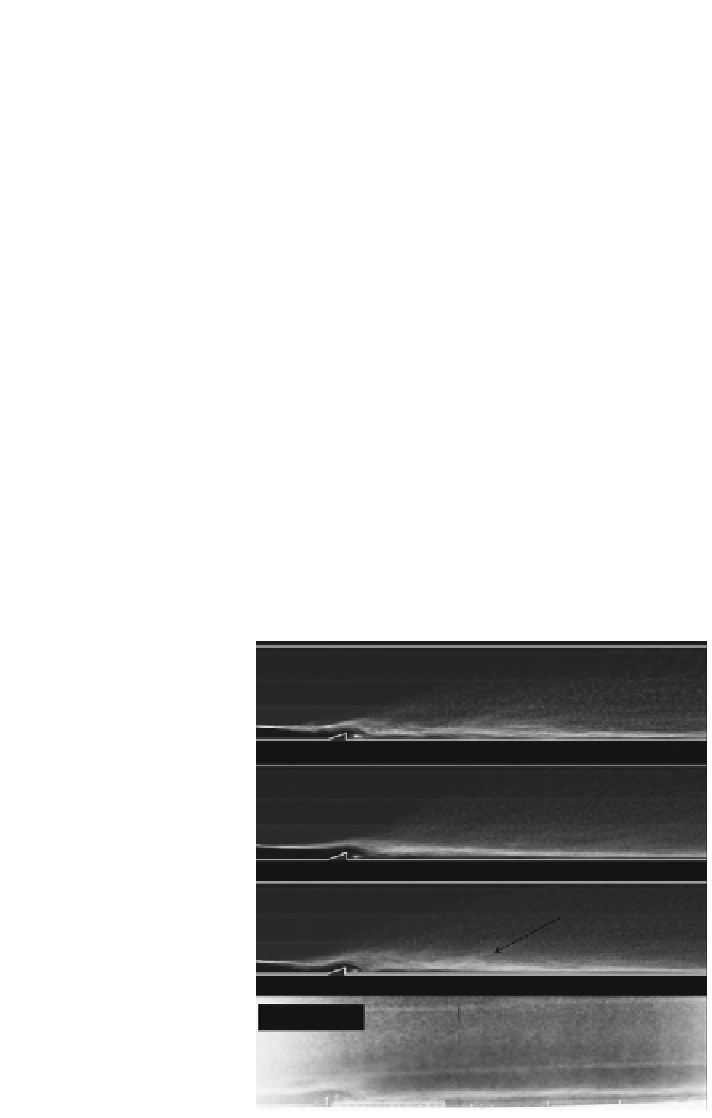
Figure
19
shows the superposition of VF with the three turbulence model and
result from experiment. The k-
model shows the least thick breakup band at the
region downstream from the ramp. The SST k-
ε
has a relatively uniformly distrib-
uted breakup band downstream of the ramp and this explains why the SST k-
ˉ
model
produced a less standard deviation of boundary length due to lower unsteady breakup
phenomenon. A wider and darker band downstream of the ramp is seen in the case of
the RSM model, which could be interpreted as a more uniform breakup process
occurring around region (i). The superposition of experimental images does not show
the probability distribution clearly due to the nonuniform distributed light source;
however, the pro
ˉ
le of the two-phase boundary in the ramp vicinity is similar to
RSM
'
s pro
le.
Fig. 19 Result of
superposition of different
turbulence models and
experiments, V
air
= 40 m/s
(Amano et al.
2014a
,
b
)
k-
ʵ
SST k-
ˉ
RSM
( i )
Experiment


Search WWH ::

Custom Search