Environmental Engineering Reference
In-Depth Information
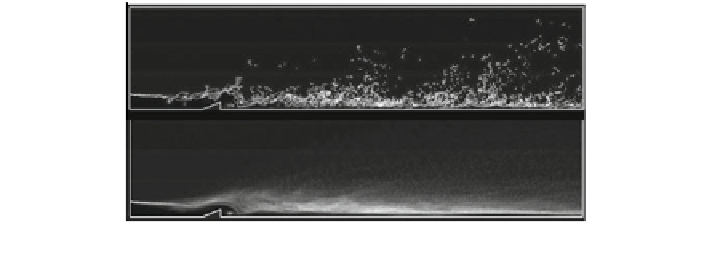
Superposition of 3 time step in
Figure 6
(a)
(b)
Superposition of 260 time steps
Fig. 9 VF
figures after superposition of a 3 time step and b 260 time steps of RSM 40 m/s
color for boundaries that change position over three time frames. The probability
distribution of the two-phase boundary movement by the superposition over three
pictures, and if 260 pictures are superposed, the resulting image becomes smoother
as shown in Fig.
9
b. Thus giving a convenient comparison of the distribution of the
average position of two-phase boundary. The time-averaged two-phase boundary
probability is a visualization indicator of different
fl
flow characteristics.
7 Results and Discussion
7.1 Experiment Result
Table
4
presents experimental calculations for two-phase mean viscosity and
density, and Speci
c Reynolds
'
and Weber numbers for varied air velocity. As seen
in Eqs. (
3
)
(
5
) and Table
4
, both mean viscosity and density vary with mean air
velocity. This air velocity dependence is due to de
-
ning the mass fraction in terms
of mass
flow rate of water was held constant, the mean
viscosity and density are solely functions of mean air velocity.
fl
flow rates. Since the mass
fl
Table 4 Speci
c Reynolds and Weber numbers at 0.676 m/s mean water velocity, surface tension
of water and air taken at 70
°
C (Amano et al.
2014a
,
b
)
Mean air
velocity (m/s)
Viscosity
(N s/m
2
)
Mean density
(kg/m
3
)
Reynolds
number (
Weber
number (
)
)
-
-
5
2.47E
−
04
21.00
86
277
10
1.47E
04
11.20
165
686
−
15
1.08E
04
7.89
243
1,141
−
20
8.73E
−
05
6.23
320
1,639
25
7.42E
05
5.23
398
2,180
−
30
6.53E
05
4.56
476
2,764
−
35
5.89E
−
05
4.08
553
3,390
40
5.40E
05
3.72
631
4,058
−


Search WWH ::

Custom Search