Environmental Engineering Reference
In-Depth Information
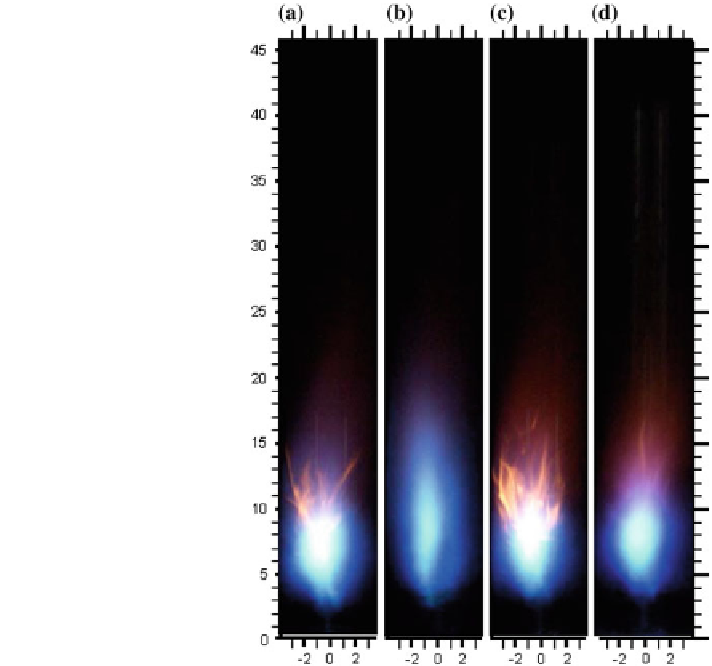
Fig. 12 Flame images at
10 % AA for a Diesel, b VO,
c 70-30 diesel-VO,
d Biodiesel
higher values for 70-30 diesel-VO blend and VO. Figure
14
b shows that the NO
X
emissions at AA = 10 % are highest for 70-30 diesel-VO blend, followed by diesel,
biodiesel, and VO. The lower NO
X
emissions for VO and biodiesel fuels are likely
caused by their lower heating value in comparison with diesel. Note that the high
heating value will result in slightly higher adiabatic
fl
flame temperature in case of
diesel. Figure
14
c shows the radial pro
les of CO emissions for AA = 15 %. For all
fuels tested, there is a signi
cant decrease in CO emissions with increase in the
atomizing air
ow rate fromAA = 10 to 15 %. For AA = 15 %, 70-30 diesel-VO blend
shows the highest CO emissions, with pro
fl
les for other fuels somewhat overlapping
with each other. No fuel showed CO emissions higher than 10 ppm for the higher
atomizing air
les of NO
X
emissions for
AA = 15 %. Results show a reduction by a factor of up to 3, as compared to the NO
X
emissions for AA = 10 %. The diesel and VO produced the highest NO
X
emissions,
while biodiesel NO
X
emissions were the lowest. However, all NO
X
values were very
low; between 15 and 20 ppm (Simmons and Agrawal
2012
).
Results show low CO and NO
X
emissions for all fuels at different atomizing
fl
ow rate. Figure
14
d shows the radial pro
air
fl
ow rates. CO and NO
X
emissions decreased with increasing atomizing air
fl
ow
Search WWH ::

Custom Search