Environmental Engineering Reference
In-Depth Information
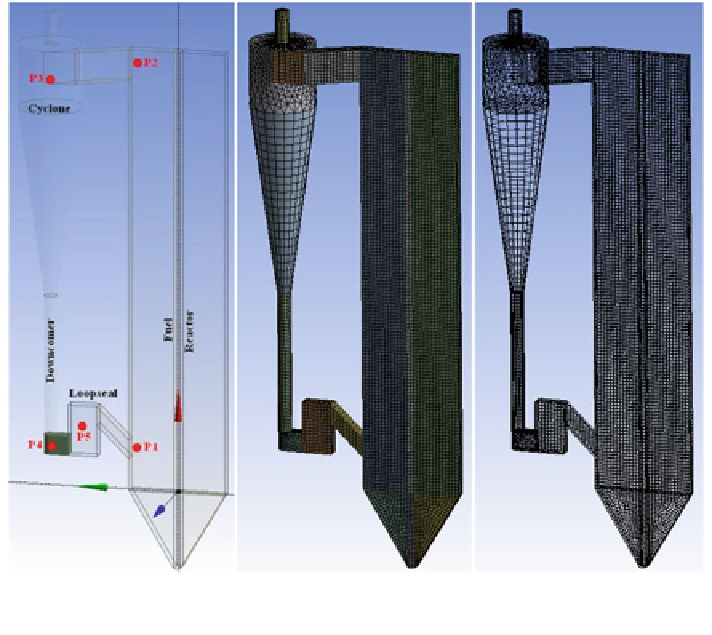
Fig. 15 Geometry outline with five pressure taps (left), mesh (middle), and wireframe (right)of
the modified complete CD-CLC configuration
reactor and downcomer is to compensate for the height added by the bottom chute
so that suf
ciently large number of particles can still reach the top of the fuel reactor
with unaltered
fluidization conditions.
The computational cost of simulation for the modi
fl
guration
shown in Fig.
15
is similar to that for the original case of Fig.
12
. The simulation results
of particles distributions for the
ed CD-CLC con
first 1,600 ms of jet injection are shown in Fig.
16
.
With the proposed design modi
cations,
the improvement
in the CD-CLC
system performance is very signi
cant. As seen in Fig.
16
, a gas bubble is formed
in the
first 480-ms shooting a large portion of solid particles into the cyclone. From
520 to 1,340 ms, the remaining particles fall back into the bed, while the particles in
the cyclone get separated from the
flue stream and drop into the downcomer.
Encouragingly, the formation of a second gas bubble is observed from around
1,380 ms onward once a large number of falling particles reach the bed. In addition,
continuous solid recirculation from the loop seal is observed in the process along
with the elimination of the dead zone in the fuel reactor. The recirculation of solid
particles can also be assured quantitatively by examining the static pressures as
shown in Fig.
17
at the
fl
five pressure tap locations (P1
-
P5) shown in Fig.
15
at
t = 400, 800, 1,200, and 1,600 ms.
Search WWH ::

Custom Search