Environmental Engineering Reference
In-Depth Information
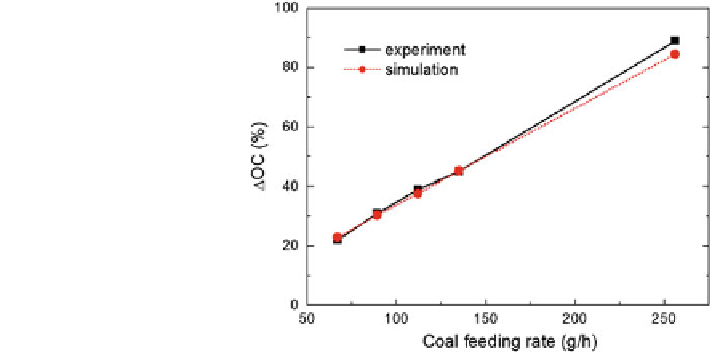
Fig. 5 Comparison of
oxygen carrier ef
ciency
between the simulation and
the experiment
reactor
fl
ue stream and the O
2
concentration in the air reactor
fl
ue stream are
examined.
3.2.2 Gas Concentration
Figure
6
a compares the CO
2
and O
2
concentration in the fuel reactor flue stream
obtained from both the experiment and the simulation for different coal feeding
rates. The concentration of CO
2
increases and concentration of O
2
decreases almost
linearly with an increase in the coal feeding rate. The deviation from linearity at low
coal feeding rates is likely due to the incomplete mixing of oxygen carrier and coal,
which is signi
cantly mitigated at higher coal feeding rates. The relatively low
concentration of O
2
in the
flue stream, as shown in Fig.
6
a, suggests that the
decoupling of oxygen from the oxygen carrier occurs in an on-demand manner, i.e.,
it is determined by the presence of coal in the system. This is supported by Fig.
6
b,
which shows that the depletion of O
2
in the air reactor increases with an increase in
the coal feeding rate. Overall, the CO
2
and O
2
concentration levels predicted by the
ASPEN Plus are in good agreement with the experimental data. Possible
improvements in the simulation results can be obtained by calculating a more
accurate value for char combustion and mass
fl
fl
flow rate of solids.
3.2.3 Energy Balance
Figure
7
compares the thermal power output from the experiment and the ASPEN
Plus simulation for the entire CLOU system for different coal feeding rates. It can
be seen that the estimated power output obtained from the ASPEN Plus simulation
is in reasonably good agreement with the experimental values. The slight
Search WWH ::

Custom Search