Environmental Engineering Reference
In-Depth Information
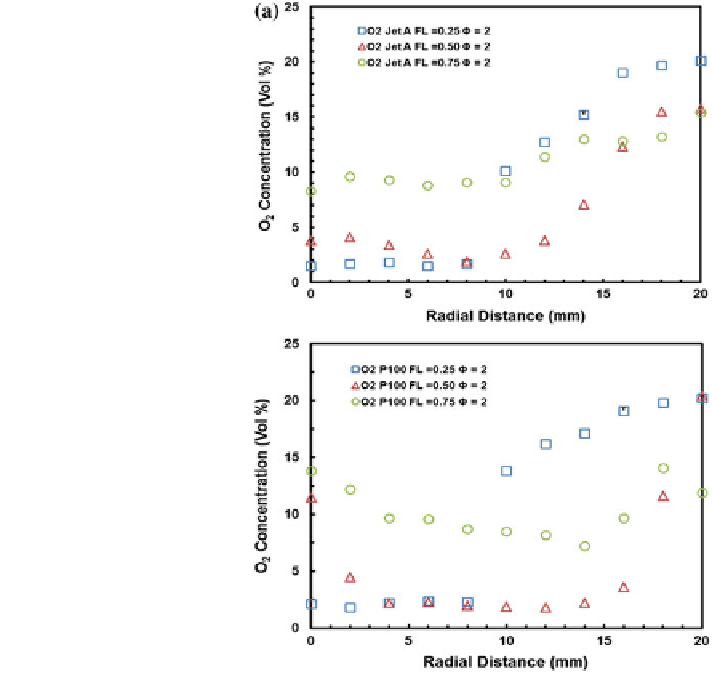
Fig. 8 a O
2
concentration
pro
les in Jet A and P100
flames,
Φ
=2.b O
2
concentration pro
les in Jet A
and P100 flames,
Φ
=3.c O
2
concentration profiles in Jet A
and P100 flames,
Φ
=7
fl
flames due to the signi
cant oxygen content in the fuel molecule. At 75 %
fl
ame
height, the CO concentration was comparable in both
fl
flames and the total CO
remaining at the end of the PME
fl
flames was smaller than that in the Jet A
fl
ames (as
seen in the global CO emission index).
The NO concentration pro
les, displayed in Fig.
11
a
c, indicate that the peak
-
NO concentration occurred at 25 %
fl
flame height, where the peak
fl
ame temperature
was reached (Fig.
6
a
c). The NO concentration was higher, and the radial pro
le
-
was wider in the PME
fl
flames than in the Jet A
fl
flames due to the increased
Search WWH ::

Custom Search