Environmental Engineering Reference
In-Depth Information
5 Results and Discussion
5.1 Flame Visualization
The
fl
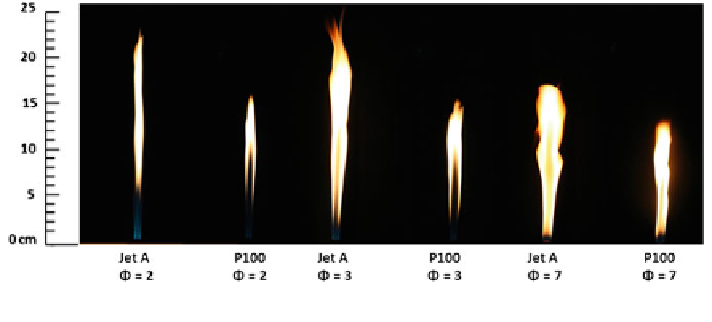
flame photographs (exposure time of 1/25 s) are presented in Fig.
3
. The Jet A
fl
flames were longer than the corresponding P100
fl
flames at all equivalence ratios.
The highest
=3,
corresponding to the maximum sooting height. In the near-burner region, a blue
region corresponding to the homogenous gas-phase reaction zone was observed.
The size of this region decreased as the equivalence ratio was increased due to the
reduction in the amount of air injected. Also, the size of the blue region was longer
for the P100
fl
flame length was recorded for both Jet A and P100
fl
ames at
Φ
flames at all equivalence ratios due to the increased oxygen content in
the fuel (Table
1
).
fl
5.2 Global Emission Indices
The global CO and NO emission indices of the Jet A and P100
ames are presented
in Figs.
4
and
5
, respectively. The CO emission index increased with equivalence
ratio (a dramatic increase was observed at the equivalence ratio of 7) due to the
reduction in the amount of injected air. The CO emission index of the P100
fl
fl
ames
was smaller than that of the Jet A
flames due to the presence of oxygen in the fuel.
The NO emission index decreased with equivalence ratio due to a reduction in the
fl
fl
flame temperature (as will be seen subsequently). The NO emission index of the
P100
fl
flames was lower than that of the Jet A
fl
flames, with the difference becoming
smaller at the equivalence ratio of 7. The in-
fl
ame temperature and gas concen-
tration pro
les will help understand the reasons for this behavior.
Fig. 3 Flame images at equivalence ratios of 2, 3, and 7 (exposure time of 1/25 s)
Search WWH ::

Custom Search