Environmental Engineering Reference
In-Depth Information
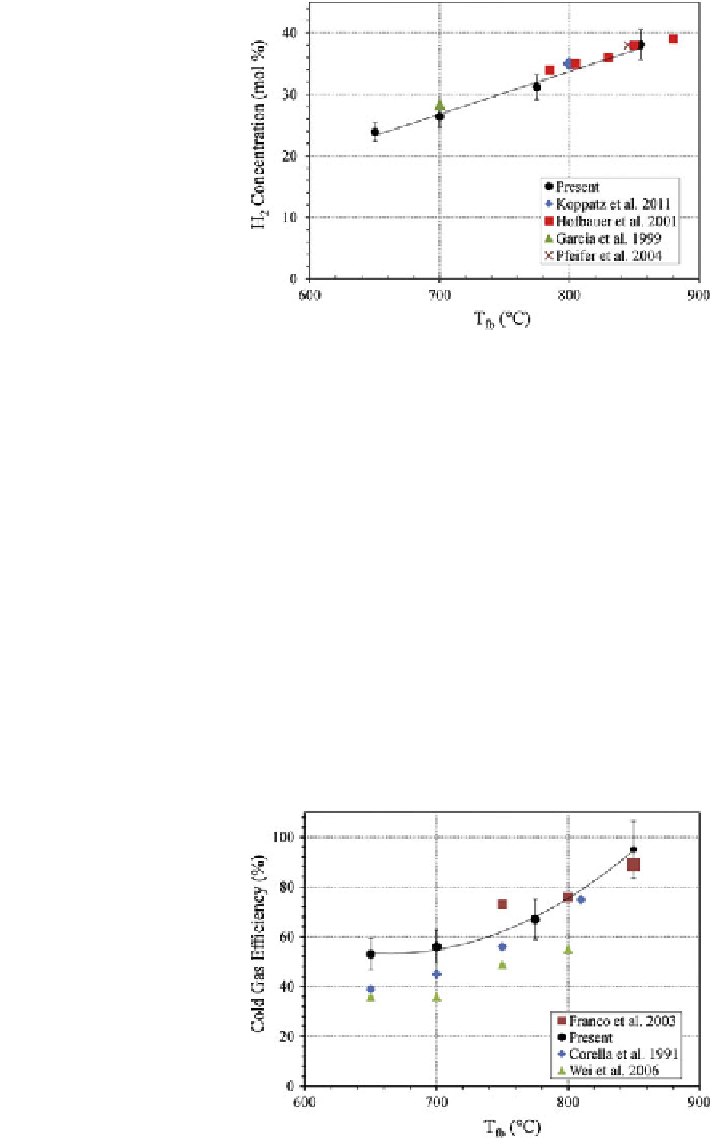
Fig. 5 Comparison of
hydrogen concentration at
similar run conditions
(S/B = 0.8
±
0.25,
τ
= 2.0
±
0.5)
ciency is also compared to published data at similar tempera-
tures and S/B ratios and is shown in Fig.
6
(Corella et al.
1991
; Franco et al.
2003
;
Xu et al.
2004
). The cold gas ef
The cold gas ef
ciency is reported less frequently than hydrogen
concentration, as a result the residence times could not be perfectly matched. The
cold gas ef
ciency is de
ned as follows:
Þ¼
m
syngas
HHV
syngas
Cold Gas Efficiency CGE
ð
m
b
HHV
b
where subscript b denotes the biomass. Variation in residence time, gasi
er shape,
feedstock, feedstock entry points, and method of heating all effect CGE. Wei et al.
(
2006
) used a dual
er system that burned a portion of the char in
a separate chamber. This is a possible reason why their reported ef
fl
fluidized bed gasi
ciency is lower.
Additionally, Corella et al. (
1991
) injected biomass at the top of the
fl
fluidized bed,
resulting in lowered gasi
cation ef
ciency. Despite these differences, the trend of
Fig. 6 Comparison of
temperature effect on cold gas
ef
ciency (S/B = 0.8,
τ
= 2.2 s)

Search WWH ::

Custom Search