Biomedical Engineering Reference
In-Depth Information
(b)
100%
50%
0%
0 00
200
300
(a)
(c)
500 nm
Diameter/nm
100.00
10.00
1.00
0.10
0.01
(d)
Wt% H
2
O
100
Wt% coating
Nb% H
2
O
Nb% coating
50
0
1
10
100
Diameter/nm
1000
10000
(e)
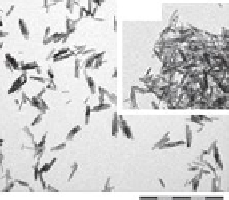
FIGURE 3.2
Classification results from multiple labs and several methods on an identi-
cal batch of iron oxide hydrate Pigment Yellow 42. (a) Monolayer-transmission electron
microscopy (TEM) images after dipping the grid in the sample that was wetted by ethanol;
(b) another sector on the same grid, which had to be excluded from evaluation; (c) TEM size
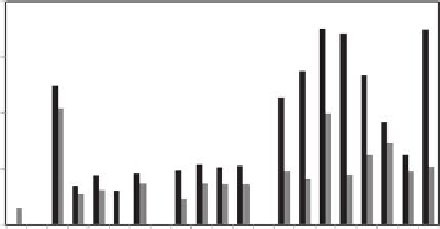
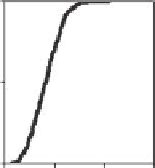
distribution resulting from semiautomated evaluation of 282 primary particles; (d) median
diameter in the originally measured metrics (black) and after conversion to number metrics
(grey). (Replotted from Gilliland D, Hempelmann U (2013) Inter-laboratory comparison of
particle size distribution measurements applied to industrial pigments and fillers. Presented to
ECHA (European Chemicals Agency), October 2, 2013.) The values of TEM-BASF originate
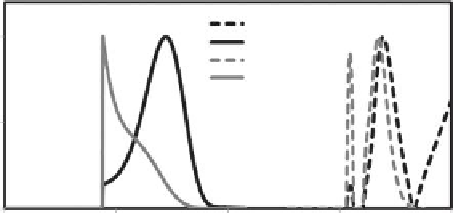
from plot (c), and the values of CLS-BASF originate from plot (e) dashed lines; (e) full size
distributions from centrifugal liquid sedimentation (CLS) in mass metrics (black) converted
to number metrics (grey), with powder dispersed by probe sonication in H
2
O with a dispersant
(dashed lines) or dispersed by application-specific shaking in organic coating (solid lines).
Search WWH ::

Custom Search