Biomedical Engineering Reference
In-Depth Information
10'000
1'000
100
10
1
0.1
Date
FIGURE 15.6
Ag (filled circles) and Ti (open squares) concentrations of runoff events
from a nano-Ag containing paint applied to a small model house. (Reprinted from
Environ.
Pollut
., 158, Kaegi, R. et al., Release of silver nanoparticles from outdoor facades, 2900-2905.
Copyright 2010, with permission from Elsevier.)
60
Ca
C
O
50
40
30
20
10
0
0123 4
Area 2
Si
1
3
B
Ca
Na
P
Cu
A
56
Energy [keV]
78910
2
500 nm
Si
C
O
60
Ti
60
50
40
30
20
10
0
50
40
30
20
10
0
0123 45 67
Energy [keV]
Area 3
Area 1
O
Na
Al
P
S
Ag
Ca
C
Si
Ti
Cu
Cu
8910
0123 45 67
Energy [keV]
8910
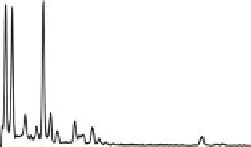
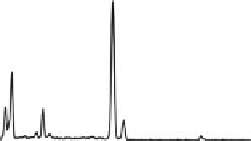
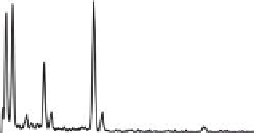
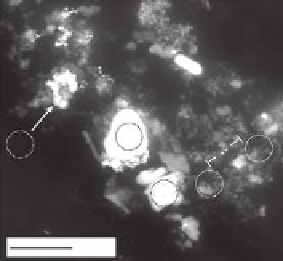
FIGURE 15.7
Electron microscopy image of Ag-containing particles released from paint
and energy dispersive X-ray spectroscopy spectra of three areas. (Reprinted from
Environ.
Pollut
., 158, Kaegi, R. et al., Release of silver nanoparticles from outdoor facades, 2900-2905.
Copyright 2010, with permission from Elsevier.)


Search WWH ::

Custom Search