Biomedical Engineering Reference
In-Depth Information
Clear epoxy
Epoxy 5% Nano Si
Epoxy 0.72%
MWCNT
Clear epoxy
Epoxy 5% Nano Si
Epoxy 0.72%
MWCNT
100%
30%
80%
20%
60%
40%
20%
10%
0%
0%
0
10 0 0
Days
40
50
0
10 0 0
Days
40
50
(a)
(b)
0 day
11 days
29 days
43 days
(c)
2 µm
5 µm
5 µm
5 µm
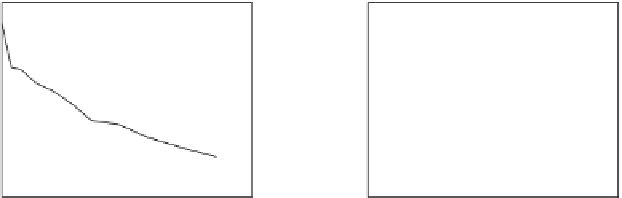
FIGURE 14.2
Transmission FTIR intensity changes of (a) 1245 cm
−1
and (b) 1714 cm
−1
bands with exposure time for a 6-µm film of neat epoxy, epoxy/0.72% MWCNT composite,
and epoxy/5% nanosilica composite exposed to UV/50
o
C/75% RH at 18.5 MJ/m²/day in the
NIST SPHERE. Each data point was the average of four specimens and error bars repre-
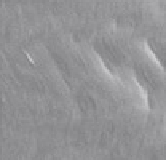
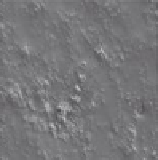
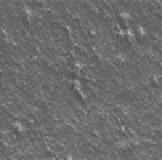
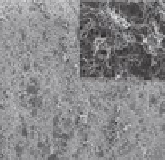
sent one standard deviation. (c) SEM images of epoxy/0.72% MWCNT composite surface for
several exposure times, showing the dense entangled network of CNTs.
composite for comparison. These data were obtained from nanocomposite and neat
epoxy films having a thickness of approximately 6 µm cast on CaF
2
prisms. (It should
be mentioned that transmission FTIR provides more accurate quantitative data on
polymer degradation than those obtained by FTIR in the attenuated total reflection
[ATR] mode, which are often reported in the polymer degradation literature.) The
results of Figures 14.2a and b clearly show that the rates of both chain scission and
photo-oxidation of the epoxy/MWCNT nanocomposites were lower than those of
the neat epoxy or epoxy/nanosilica composites, consistent with data for epoxy/3.5%
MWCNT composite (Petersen et al. 2013), PU/MWCNT composite (Nguyen 2008),
and the photostabilization effect of the aforementioned reviewed MWCNTs.
SEM images of the same epoxy/MWCNT nanocomposite irradiated under
the same UV conditions for several time intervals are displayed in Figure 14.2c. The
surface before exposure appeared smooth with little evidence of MWCNTs. The
absence of nanofillers and the smooth appearance, which is similar to that of epoxy/
nanosilica composite (Figure 14.3), suggested that a thin layer of epoxy material
probably covered the nanocomposite surface. The presence of such a layer potentially
influences the rate of matrix degradation of a polymer nanocomposite. As seen in
Figure 14.2c, bundles of MWCNTs became visible on the surface after 11 days, and
their concentration increased with increasing exposure time. After 43 days, MWCNTs


Search WWH ::

Custom Search