Biomedical Engineering Reference
In-Depth Information
chosen to quantify particle uptake under in vitro conditions: Starting with a single
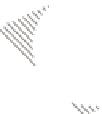
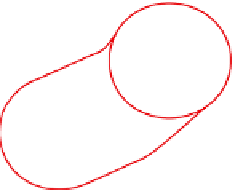
macrophage and a few particles spread over the scene (Figure 7.8a) the number of
sedimented particles will increase over time in the control ROI (black circle), but
will be diminished in the active ROI (red circle) as long as the macrophage is able
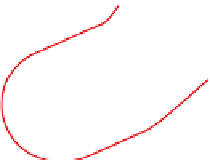
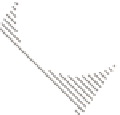
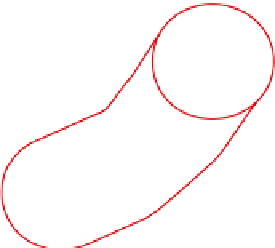
to phagocytize. The area through which the macrophage has driven its comigrating
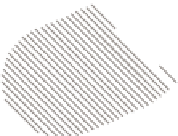
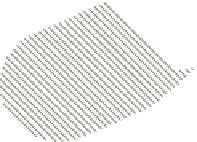
active ROI is shown as a hatched field (Figure 7.8b-d).
The number of particles ingested by a single macrophage, therefore, can be
described as the difference between two cumulative curves obtained from the control
and the active ROI (Figure 7.9), provided that: (a) both regions are equally large;
(b) particles are equally distributed; and (c) the area occupied by the macrophage is
regarded as cleared. The last point cannot be controlled but is a well justified assump-
tion because particles contacting the macrophage surface are readily ingested or
roll off the surface and appear in the vicinity. Although the strategy to subtract the
(a)
(b)
(c)
(d)
FIGURE 7.8
Procedure to analyze particle uptake under dynamic conditions, as used in
the program “AM Tracking.” Four consecutive virtual scenarios are shown (a-d). Settling
particles are shown as black dots, a motile macrophage is represented by the gray area; con-
trol and macrophage regions are shown as black and red circles, respectively. The hatched
area represents the field the macrophage had partially cleaned from particles. Particles in
the control region increased from 4 (a) to 10 (d). Assuming an even distribution of particles,
there should have been 37 particles within the hatched plus the macrophage area. As only
15 remain, 22 particles had been ingested. Note that this number could not be retrieved if only
the final scenario (d) was considered.











Search WWH ::

Custom Search