Biomedical Engineering Reference
In-Depth Information
characterize particle number and diameter. They demonstrated considerable num-
bers of nanoparticles, particularly for the dominant constituent of the electronic ciga-
rettes, PG. They conclude that
in vitro
experiments show that electronic cigarettes
and conventional cigarettes produce aerosols with similar particle sizes.
5.4.2 a
ir
P
ollution
There is increasing recognition that particulate matter (PM) in ambient air both indoors
and outdoors contains significant fractions of ultrafine particles (UFPs) (100 nm or
less). Even though their contributions to the mass of total suspended particulates,
PM
2.5
or PM
10
, are small, they are the dominant contributors to particle number and
contribute significant surface areas. A recent report by the Health Effects Institute
summarizes concerns and concludes that there is significant evidence showing that
the health of animals and humans can be affected by UFPs (HEI 2013).
Epidemiologic studies are more difficult because exposure to UFPs is generally
not documented. However, the contribution of UFPs to overall health effects from air
pollution cannot be excluded. This report and others conclude that the contribution
of UFPs is not proportional to their mass. Their toxicity per unit weight is greater
than that of larger particles. Another attribute of UFPs, and indeed for all nanopar-
ticles, is that they are more persistent because they are slowly removed from ambient
air by settling or by inertial impaction. They often tend to grow because of regulation
mechanisms.
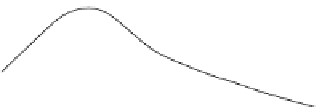
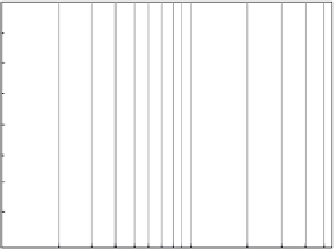
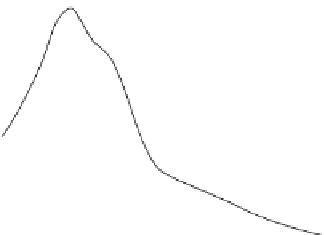
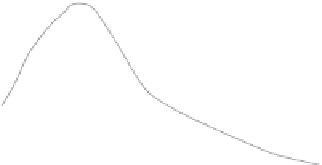
Figure 5.2 describes a particle size distribution in a street canyon in Shanghai,
China, as a function of increasing altitude in relation to the street (Li et al. 2007).
The majority of particles by number are smaller than 100 nm. The concentrations
are greatest at 1.5 m from the street surface. As one moves higher and farther from
the street, the concentration of mobile source emissions, resuspended road dust, and
1.6 × 10
5
38 m
20 m
8 m
1.5 m
Test II
1.2 × 10
5
8.0 × 10
4
4.0 × 10
4
0.0
10
100
Particle diameter (nm)
FIGURE 5.2
Nanoparticles in urban air: A street canyon in Shanghai (particle number con-
centration and size distribution change with increasing height). Measurements were made
during daylight hours in November 2005. (Reprinted from
Sci. Total. Environ
., 378, Li, X.L.
et al., Vertical variations of particle number concentration and size distribution in a street
canyon in Shanghai, China, 306-316, Copyright 2007, with permission from Elsevier.)


Search WWH ::

Custom Search