Agriculture Reference
In-Depth Information
0.30
35
0.25
30
0.20
25
0.15
20
0.10
1990
1995
2000
Year
2005
2010
N content diet
N efficiency
9000
18
8000
17
7000
16
15
6000
14
5000
1990
1995
2000
Year
2005
2010
Milk production
Methane prodiction
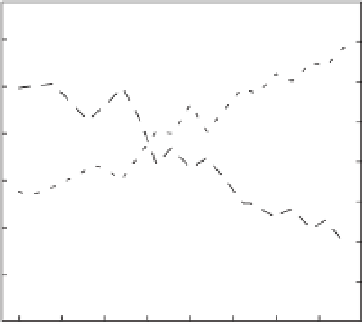
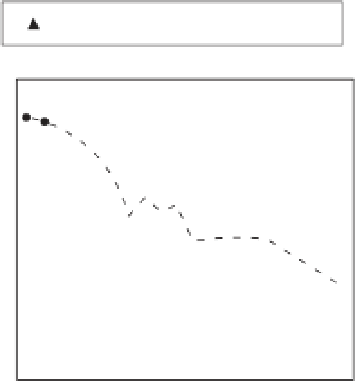
Fig. 2.5.
Dietary nitrogen (N) content (g kg
−1
DM) and N efficiency (g milk N g
−1
feed N) (top) and milk
production (kg fat and protein corrected milk (FPCM) per cow per year) and methane (CH
4
) production
(g CH
4
kg
−1
FPCM) (bottom) for the average dairy cow in the Netherlands from 1990 until 2009. Data and
CH
4
calculations from 1990 until 2008 as described in Bannink
et al
. (2011) with 2009 results added
according to the various sources and calculation procedures mentioned by Bannink
et al
. (2011).
linear equation though, further reductions in
GHG emissions per kg FPCM are possible with an
asymptotic value of 0.86 kg CO
2
-e year
−1
. In this
analysis of dairy production systems with one
average value per country in the database,
increased milk production reduced emissions of
CH
4
and N
2
O per kg milk, but increased CO
2
emis-
sion per kg milk which according to Gerber
et al
.
(2011) reflects the increased use of inputs whose
production requires fossil fuel, notably high-value
feed. In deriving the linear and non-linear equa-
tions, Gerber
et al
. (2011) used different responses
(CO
2
-e per cow per year, or per kg FPCM). It is dif-
ficult to discriminate on statistical grounds
between the two equations. Problems with model
assumptions on normality and homoscedasticity
may occur with both equations. Capper
et al
.
(2009) reported a decline in GHG emission of 3.6 kg
CO
2
-e kg
−1
FPCM (1944; 2061 kg FPCM per cow
per year) to 1.35 kg CO
2
-e kg
−1
FPCM (2007;
8715 kg FPCM per cow per year). According to
the non-linear equation of Gerber
et al
. (2011),
the GHG emission would be 2.51 and 1.38 kg
CO
2
-e kg
−1
FPCM, respectively. The linear equation