Game Development Reference
In-Depth Information
Notice how the cumulative TE reduced with each release and settled at .042. You can
take this measurement one step further by using test completion and defect detection
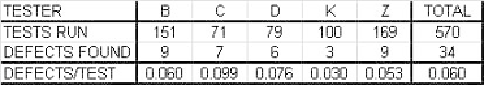
data for each tester to calculate individual TEs. Figure 9.7 shows a snapshot of tester
TEs for the overall project. You can also calculate each tester's TE per release.
Figure 9.7
TE measured for individual testers.
Note that for this project, the effectiveness of each tester ranges from 0.030 to 0.099,
with an average of 0.060. The effectiveness may be as much a function of the particu-
lar tests each tester was asked to perform as it is a measure of the skill of each tester.
However, like the overall TE measurement, this number can be used to predict how
many additional defects a particular tester may find when performing a known num-
ber of tests. For example, if tester C has 40 more tests to perform, expect her to find
about four more defects.
In addition to measuring how many defects you detect (quantitative), it is important
to understand the severity of defects introduced with each release (qualitative). Using
a defect severity scale of 1 to 4, where 1 is the highest severity, detection of new severity
1 and 2 defects should be reduced to 0 prior to shipping the game. Severity 3 and 4
defect detection should be on a downward trend approaching 0. Figures 9.8 and 9.9
provide examples of severity data and a graph of these trends, respectively.
Take a moment to examine the graph. What do you see? Notice how the severity 3
defects dominate. They are also the only category to significantly increase after Dev1
testing, except for some extra 4s popping up in the Demo1 release. When you set a
goal that does not allow any severity 2 defects to be in the shipping game, there will
be a tendency to push any borderline severity 2 issues into the severity 3 category.
Another explanation could be that the developers focus their efforts on the 1s and 2s
so they leave the 3s alone early in the project with the intention of dealing with them
later. This approach bears itself out in Figures 9.8 and 9.9, where the severity 3 defects
are brought way down for the Demo1 release and continue to drop in the Alpha1
release. Once you see “what�? is happening, try to understand “why�? it is happening
that way.