Game Development Reference
In-Depth Information
Figure 9.1
Planned and actual test execution progress data.
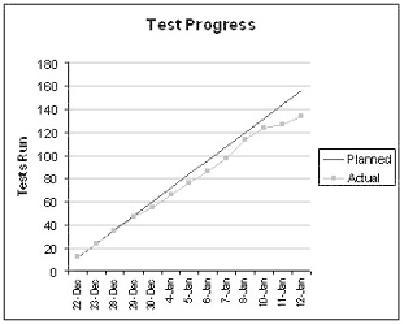
Figure 9.2
Planned and actual test execution progress graph.
To understand what is happening here, collect data for each day that a tester was available
to do testing and the number of tests he or she completed each day. This information can
be put into a chart, as shown in Figure 9.3. The totals show that an individual tester
completes an average of about four tests a day.