Game Development Reference
In-Depth Information
issue entry and processing, but this will keep the team software licensing and opera-
tion costs down and make it easy for the rest of the team to access and update QA
issues.
Some statistical methods might be useful for QA analysis of project and process
results. Many of these methods are supported by tools. Such tools and methods
should be identified in the SQAP. For example, Pareto Charts graph a list of results in
descending order. The bars furthest on the left are the most frequently occurring
items. These are the issues you should spend your time on first. If you are successful
at fixing them, the numbers will go down and other issues will replace them on the
left of the chart. You can go on forever addressing the issue at the left of the chart
because there will always be one. This is kind of like trying to clean out your garage.
At some point in time, you can decide the results are “good enough�? and move on to
some entirely different result to improve.
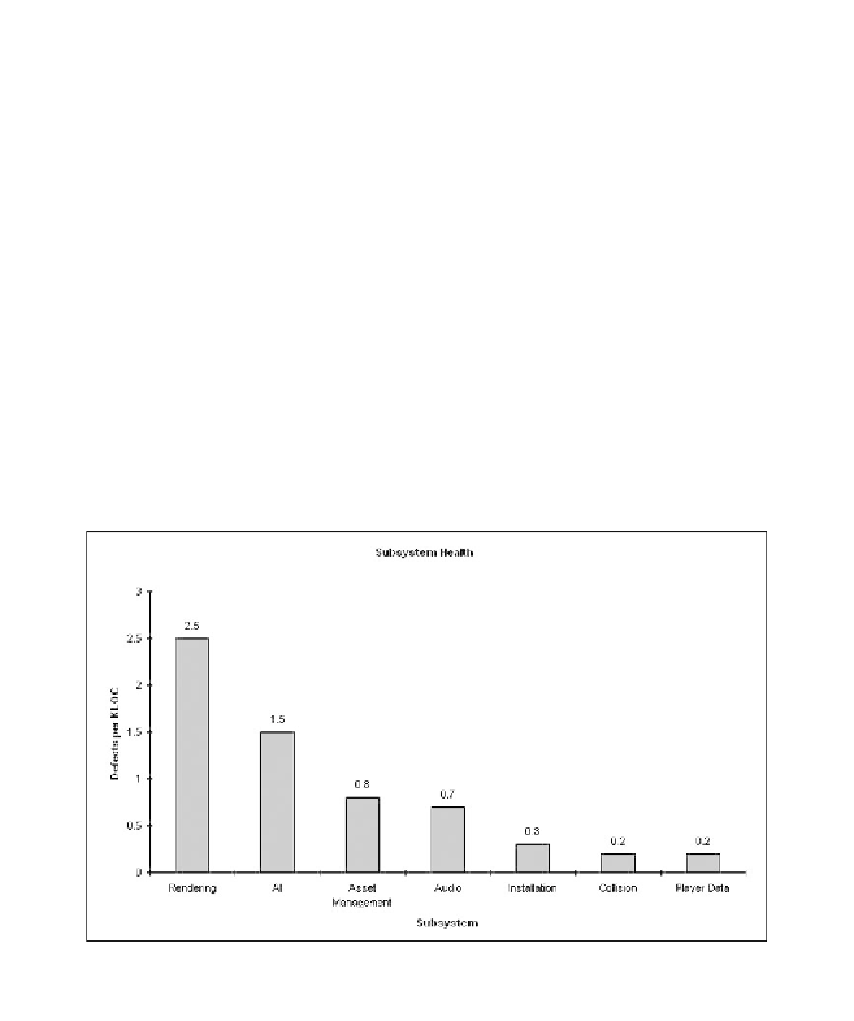
Figure 6.7 shows an example Pareto Chart of the number of defects found per thousand
lines of code (KLOC) in each major game subsystem. The purpose of such a chart could be
to identify which portion of the code would benefit the most from using a new automated
checking tool. Because there are costs associated with new technologies—purchasing,
training, extra effort to use the tool, and so on—it should be introduced where it would
have the greatest impact. In this case, start with the rendering code.
Figure 6.7
Pareto Chart of defects per KLOC for each game subsystem.