Information Technology Reference
In-Depth Information
database may not include capsaicin concentration, but data on the average amount
of pepper used in existing recipes serves as a substitute. Similarly, in the absence
of data regarding basic tastes such as bitterness or sourness, the recipe database
would likely indicate that lime and grapefruit are used in smaller amounts than navel
oranges. Even in the absence of the expertise of a qualified chef, the data-driven
approach that we have described can create effective and balanced recipes.
16.5 Generating Recipe Instructions
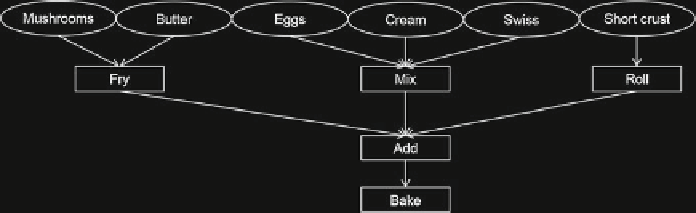
In the knowledge database, recipe instructions have been parsed into sequences of
tasks that connect the ingredients to the final product. These sequences can be viewed
as a directed acyclic graph, as shown in the example on Fig.
16.7
. Vertices represent
either ingredients or tasks, and the edges capture their ordering. Unlike in a cookbook
where the writing imposes that all the actions follow a single thread, a graph displays
many steps being completed in parallel: by analyzing the inputs and outputs of each
step, we only retain the edges that are strictly necessary.
At the highest level, tasks are described by a verb that represents a category of
similar cooking actions. Figure
16.8
presents an ontology of preparation methods,
compiled by Michael Laiskonis, Creative Director at the Institute of Culinary Edu-
cation [
27
]. The ontology can be completed with synonymous verbs using a lexical
database such as WordNet [
28
].
The recipes created by our system are entirely novel and do not result from simple
ingredient substitutions in existing recipes. The large number of possible dishes and
the many variations within the same dish also make it impossible to design templates
that could simply be customized to match a given ingredient combination. For these
reasons, we choose to proceed in two steps.
In the first step, we examine each ingredient individually, and create one or more
plausible sequences of tasks it could be involved in. Each sequence constitutes a sub-
graph that starts with one ingredient and ends with the last recipe task, which produces
the final product. For each ingredient, we start by extracting all the subgraphs for the
Fig. 16.7
Example of an acyclic graph representing recipe instructions for a simple mushroom
quiche

Search WWH ::

Custom Search