Biology Reference
In-Depth Information
emission or by upconversion of the few fluorescence photons. Although these
methods can be applied, in principle, to lifetimes on the nanosecond timescale,
the experiments are mostly designed, and thus more accurate, for faster processes.
Length differences in the optical pathways between the excitation and the probe
pulse are converted to a time delay. Path differences of 1 m, which are rarely
exceeded, correspond to roughly 3 ns.
More relevant for fluorescence lifetime measurements are, therefore, setups
where fluorescence photons are directly detected by some light-sensitive device.
The time delay between the excitation pulse, i.e., the corresponding electronic
signal, and the photon detector output is then recorded and analyzed for a large
number of photons (see Fig.
5a
, time-correlated single-photon counting (TCSPC)).
Pulsed discharge lamps of some spectrometers have instrumental response func-
tions (IRFs) with a width of ~1 ns and t
Fl
becomes trustworthy after careful
reconvolution fitting. By using pulsed lasers, the time resolution can be as good
as 50 ps and below, but, then, it critically depends on the photon counting detector.
The most sensitive photon detectors such as avalanche photodiodes are limited to
~200 ps or even worse. They are especially used in fluorescence microscopy. The
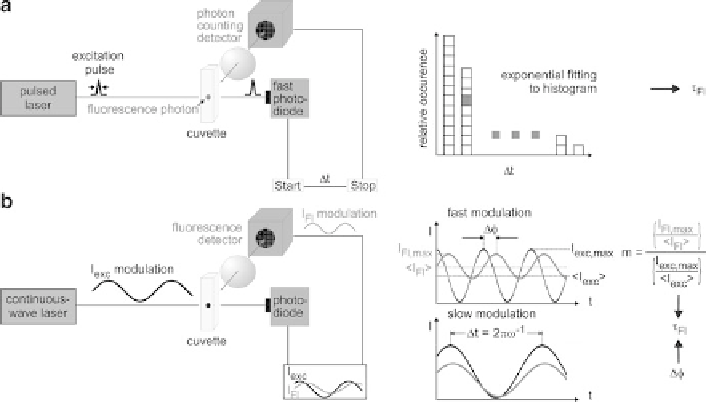
Fig. 5 Two widely used methods for the determination of t
Fl
, i.e., time-correlated single photon
counting (a) and phase fluorimetry (b). (a) The time lag
Dt
between a single detected fluorescence
photon and its excitation pulse is measured by fast electronics. A histogram is obtained from
numerous fluorescence photons with individual
Dt
. Exponential fitting of the experimental histo-
gram yields t
Fl
.(b) The sinusoidally modulated output
I
exc
of a laser generates a modulated
fluorescence signal
I
Fl
. The phase shift
D
f between excitation (
black
) and emission (
grey
) depends
on the modulation frequency o and allows for calculating t
Fl
. Another quantity is the demodula-
tion m, which is the ratio of the relative amplitude of the modulated
I
Fl
and the relative amplitude
of
I
exc
. m decreases from 1 at slow modulation, i.e., o is small, to minimally 0 at faster modulation,
i.e., o is large, and can be converted, as well, to t
Fl
Search WWH ::

Custom Search