Biology Reference
In-Depth Information
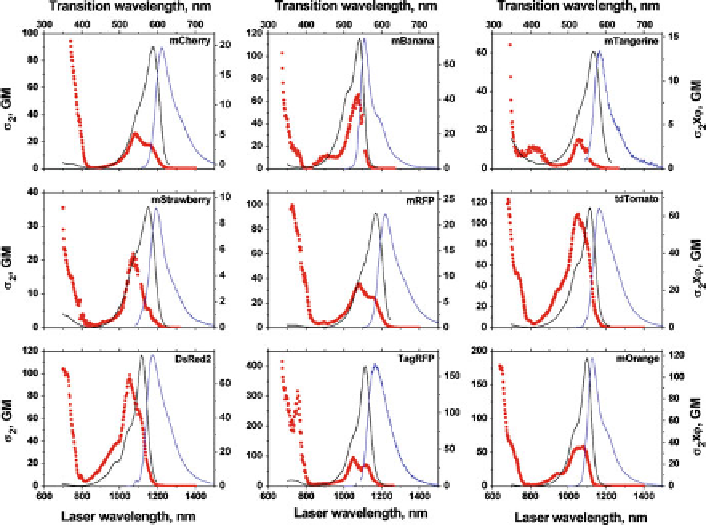
Fig. 11 Two-photon excitation spectra (
red circles
) shown along with fluorescence emission
(
blue line
) and one-photon fluorescence excitation (
black line
) spectra. The left-ordinate axis
represents the two-photon cross section (
2
) values in GM (Goeppert-Mayer), and the right-
ordinate axis represents the two-photon brightness,
s
being the fluorescence quantum
yield), in GM. The
bottom x
-axis represents the laser wavelength used for excitation and the
top x
-
axis represents the (one-photon) transition wavelength. The excitation and fluorescence emission
intensities are shown in arbitrary units. From Drobizhev et al. [
67
]
s
'
(
'
2
and for both neutral and anionic species (for instance, mKalama1 and mAmetrine
contain the chromophore in the neutral state [
21
,
24
]).
Interestingly, the profile of the two-photon band is generally blueshifted with
respect to the one-photon band and, in certain instances, rather different. Such
difference is presumably due to a different vibronic coupling between one- and two-
photon excitation. For example, interpreting the shoulder about 50 nm to the blue of
the main peak (in mWasabi, G1, G3 of Fig.
10
and in all orange/red FPs in Fig.
11
)
as a vibronic peak, it is clear that in two-photon excitation such a vibronic mode is
enhanced. It is worth mentioning that other authors explain the blueshifted two-
photon spectrum as due to the excitation to a different electronic state [
114
] lying
very close in energy to the first excited state. No such state is, however, found in
quantum chemical calculations (see Sect.
4.2
).
Another common feature of the spectra is the presence of two-photon excitation
bands in the high-energy (short-wavelength) side of the spectrum, where the one-
photon spectrum is either featureless or shows only limited one-photon excitation.
These are located below 700 nm in green/cyan/blue FPs (Fig.
10
) and start already
Search WWH ::

Custom Search