Biology Reference
In-Depth Information
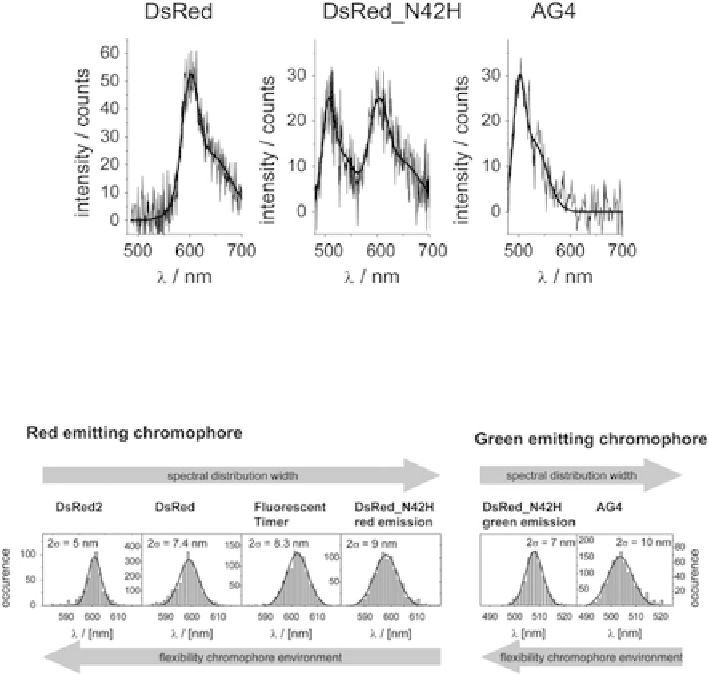
Fig. 4 Single oligomer spectra from DsRed group proteins. Different chromophores can form
within the protein, a property, which make this group of proteins ideal for studying the influence of
the chromophore embedding on the spectral diffusion (Reprinted with permission from [
51
].
Copyright 2006 American Chemical Society)
Fig. 5 Distribution of single molecule emission maximum positions from the different chromo-
phores of the analyzed DsRed variants. The distribution width and the flexibility of the chromo-
phore nanoenvironment are anti-correlated (Adapted with permission from [
51
]. Copyright 2006
American Chemical Society)
excitation power. For each variant, the red-emitting chromophore showed a differ-
ent width of the determined maximum position distribution; the same trend was
observed for the green-emitting chromophore. Clearly, this observation reflected
the differences in the local environment within different variants. Further differ-
ences in the widths of the distribution were found for green- and for red-emitting
chromophores residing within the same nanoenvironment of one specific variant
(DsRed_N42H), reflecting the differences in sensitivity of chemically different
chromophores to variations in the embedding.
Since the exact protein sequence for each variant was known and structural data
for DsRed are available, it was possible to analyze the data further to discriminate
between interactions due to changes in the chemical environment of the chromo-
phores, e.g., different residues in the nanoenvironment of the chromophore, and
changes due to differences in the flexibility of the chromophore nanoenvironment.
Search WWH ::

Custom Search