Biology Reference
In-Depth Information
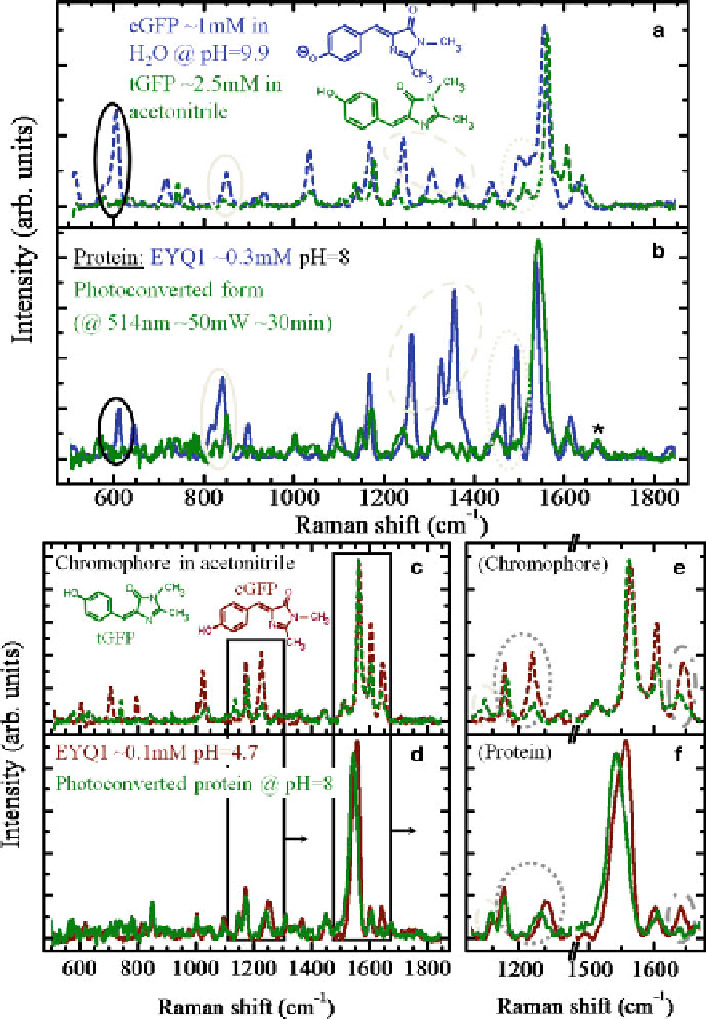
Fig. 6 Raman-driven analysis of the different isomerization and protonation states of the chro-
mophore of EYQ1. (a) Raman spectra of anionic cGFP (in aqueous solution of NaOH at pH
9.9,
dashed blue line
) and of tGFP (in acetonitrile, same data of
dark green
curve in Fig.
5a
).
(b) Raman spectra of native EYQ1 (
blue solid line
) and of its photoconverted form (
dark green
¼
Search WWH ::

Custom Search