Biology Reference
In-Depth Information
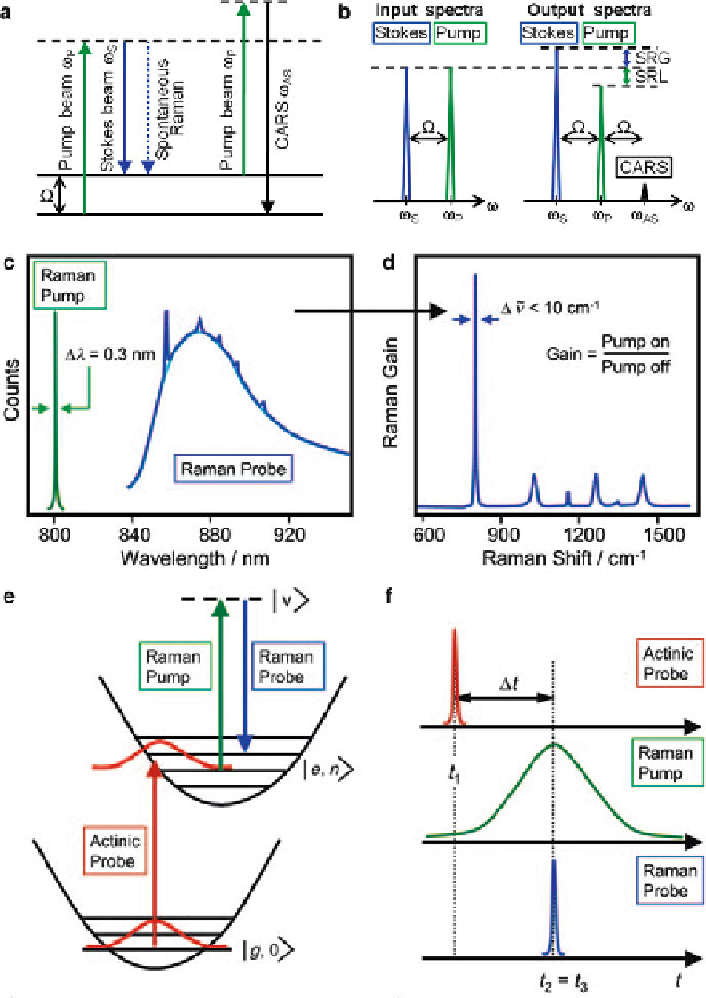
Fig. 3 (a) Energy diagram for stimulated Raman scattering (SRS) and coherent anti-Stokes
Raman scattering (CARS). (b) Scheme for the input and output spectra of SRS. SRS leads to an
intensity gain in the Stokes beam (SRG) and to a scattering Raman loss (SRL) in the pump beam.
Also shown (not to scale) is the CARS signal generated at the anti-Stokes frequency
AS
.(c, d)
Diagrams depicting the SRS spectroscopy: in panel c are shown the Raman pump line (
green line
)
and the probe continuum without (
cyan line
) and with the peaks due to stimulated Raman
o
Search WWH ::

Custom Search