Java Reference
In-Depth Information
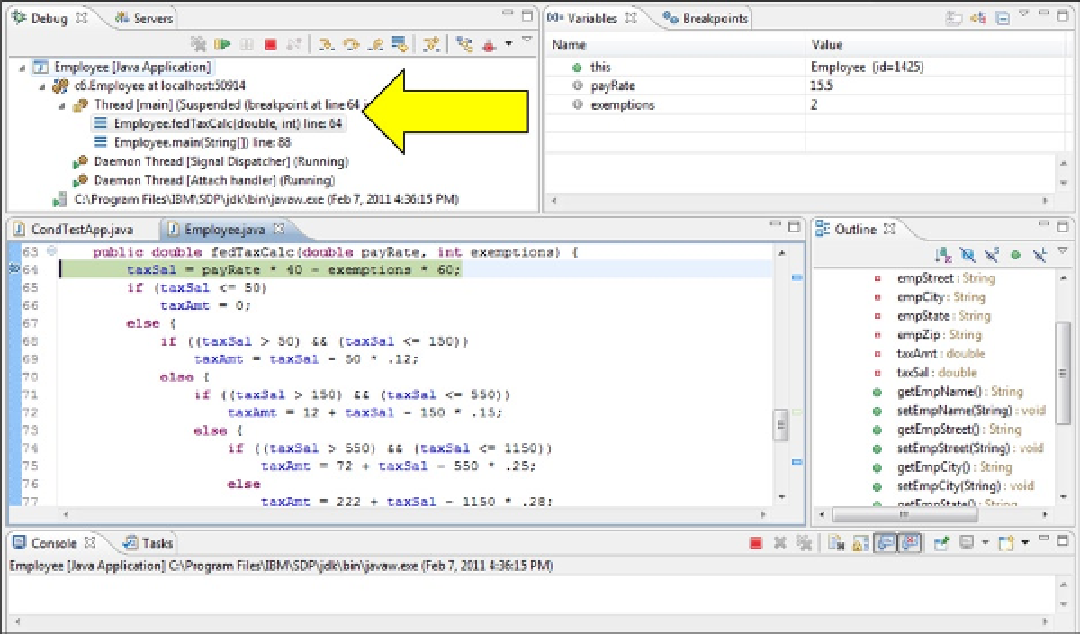
Figure 6-8.
The default Debug perspective is broken up into five panes, several of which support multiple views. We will
cover the default views.
The upper left pane (the Debug view) displays the “thread stack.” The thread stack allows you to trace the path
of execution through the various objects and methods up to the breakpoint. At the top of the stack will be an entry
displaying the breakpoint line number and method. Additional entries will be for the previous methods that were
executed (and the specific line within each that called the next method). In Figure
6-8
, notice the first (and highlighted)
stack entry for the breakpoint statement (Employee.fedTaxCalc method, line 64) and then the entry for line 88 in the
Employee.main method, which invoked the fedTaxCalc method. Essentially, the thread stack shows that the main
method was executed first, then the fedTaxCalc method. This “trace of the methods executed” is very helpful for finding
logic errors. In this case, the path in the stack trace is the path that we expected the application logic to follow. (Beware:
even if the processing flow is correct, there can still be errors in particular statements.)
The upper right pane shows the Variables view. It displays the current method's parameters and the object
(i.e., Employee). Click on the object's expansion icon (to the left of the green circle) to display the object's variables
and their values.
You can change a variable value by right clicking the variable name, choosing Change Value, and entering a
new value.
3.
Click on the Employee object's expansion box and adjust the Variables view to display the
five properties, all the variables, and their values.
The final three panes provide the same functions as in the Java perspective. At the bottom, the Console view
shows the results of println statements. The Outline view displays a tree of all the object's variables and methods and
allows you to traverse the source code by clicking the tree items. Finally, the source code pane displays the object's
source code and allows the programmer to modify the source. One difference with the Debug source pane is that the
next executable statement is highlighted, in this case, the breakpoint statement (i.e., line 46).