Game Development Reference
In-Depth Information
To make even more robust algorithms, we may not use any categories at all.
Instead, we could build a formula that takes into account the health value and con-
verts it somehow into various percentages that we will then use to make our decision.
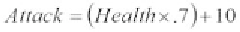
For example, we may elect to use the following formulas to create our transition
percentages:
At any given moment, we could use the agent's current health value to calcu-
late the three percentages that we need to decide what the agent is going to do next.
(Actually, we only need two, as the third option would be in effect if the first two are
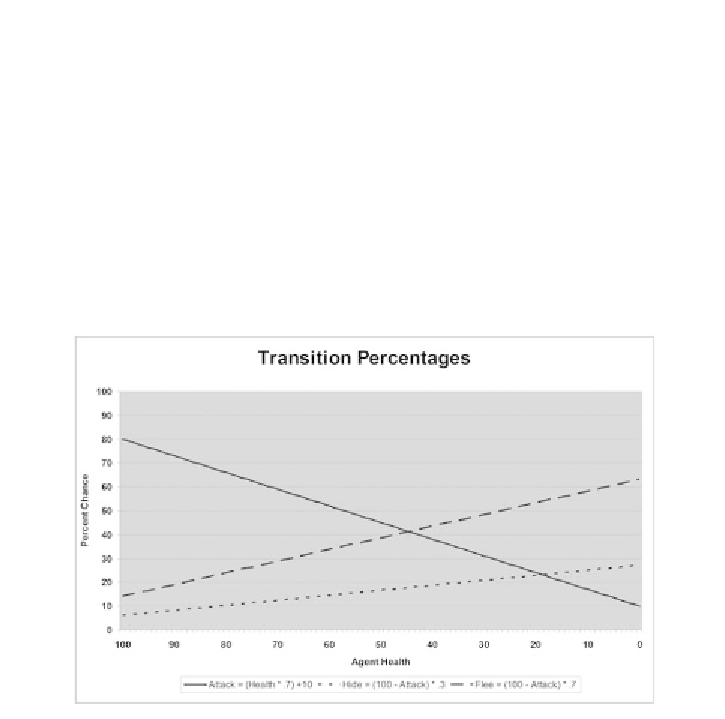
not selected.) Graphing those three formulas, we would get the results in Figure 3.6.
FIGURE 3.6
Based on the formulas shown, the percentages for the
state transitions (y-axis) to attack, hide, and flee change automatically
as the agent's health (x-axis) changes.
As you can see, the numbers follow a pattern similar to the static figures we
created in Figure 3.5. We start with about an 80% chance of attacking and small
chances of hiding of fleeing. As health reaches zero, the chance of attacking
approaches 10%, and that of fleeing arrives at 63%, with hiding coming in at 27%.