Game Development Reference
In-Depth Information
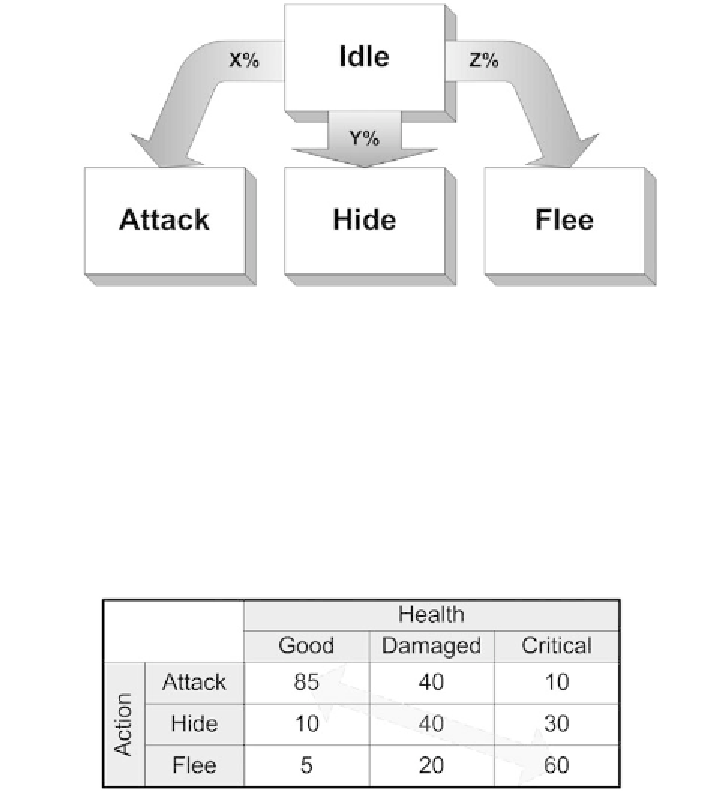
FIGURE 3.4
The transitions from the idle state to the attack, hide, and flee
states are controlled by the percentages expressed by X, Y, and Z, respectively.
The example in Figure 3.5, shows three different definitions of the state that our
agent's health could be (good, damaged, and critical). For each of those, there are
three percentage values for each of the three actions (attack, hide, and flee). Part of
defining those behaviors would be assigning those values. When our agent is in
good health, how often do we want him to attack? To flee? What about when the
agent is damaged? Should he
ever
attack when he is in a critical state of health? At
that point, we are defining when those actions should be taken.
FIGURE 3.5
Definitions of the transition percentages (X, Y, and Z) to the attack,
hide, and flee states based on whether the agent's health is good, damaged, or critical.
Note the arrow showing the approximate trend from attack to flee.
Of course, we would have to define what good, damaged, and critical health
means. Does “good�? mean 100%? Anything above 80%? 75%? That is yet another
definition that must be made. The algorithm that processes the decision itself does
not change. What is adjusted is the way the numbers are arranged. And
this
is
where most of the subtlety comes into decision making.