Game Development Reference
In-Depth Information
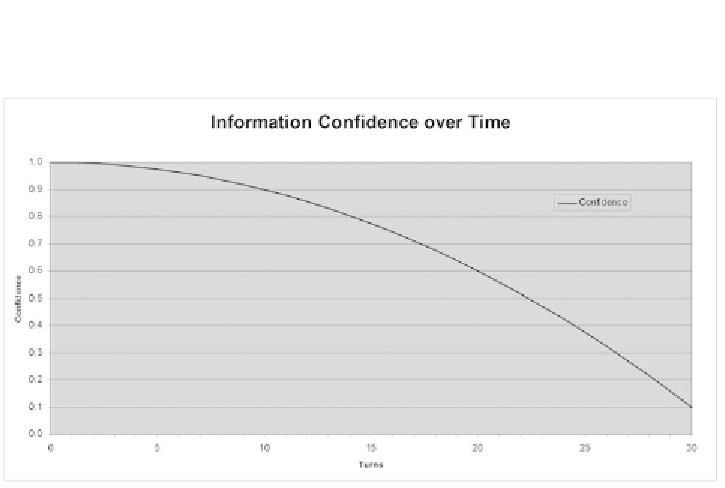
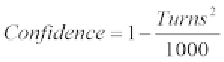
The graph in Figure 15.2, for example, follows one of our trusty formulas from
Chapter 10.
FIGURE 15.2
By constructing a decreasing marginal utility
curve such as this one, we can simulate our gradual loss of
confidence that what we know now will be relevant later.
If we can act on our decision in the next turn, we can remain fairly confident
that the information we are acting on is going to still be valid when we get there. On
the other hand, if it will take us 10 turns to arrive, we may only ascribe 90% confi-
dence to the data. As the time frame lengthens, we grow
less
confident
more
quickly.
Doubling the distance (and therefore the time) to a target would yield a 60% con-
fidence rate per the formula above. At 25 turns, our confidence is 38%, and if it will
take us 30 turns to arrive, we may only believe there is a 10% chance that our esti-
mate will be correct.
We would only apply this confidence rating to information about items that are
not
in our control. In the example above, we would only apply it to the makeup of
the city's defenses. The value of the city as a strategic target likely wouldn't change,
and we know that the makeup of
our
forces won't change. (If it does, we would
need to recalculate our plans anyway.)