Game Development Reference
In-Depth Information
One of the advantages of implementing response curves is that it gives us a new way
of looking at data. By changing our vantage point, so to speak, we are able to process
this data in ways that are more conducive to manipulation and selection.
We will start with a simple example from the previous chapter… our helpful
dentists. As we have recalled a few times, rumor has it that “four out of five dentists
recommend sugarless gum.�? If we were to generate random dentists from this data,
we would want to make sure that 80% of the time, the dentist was of the mind to
recommend sugarless gum. According to what we've been told, that's realistic, right?
Certainly, there are plenty of ways that we could generate a sugarless dentist
80% of the time. It is actually a rather simple exercise. However, for purposes of this
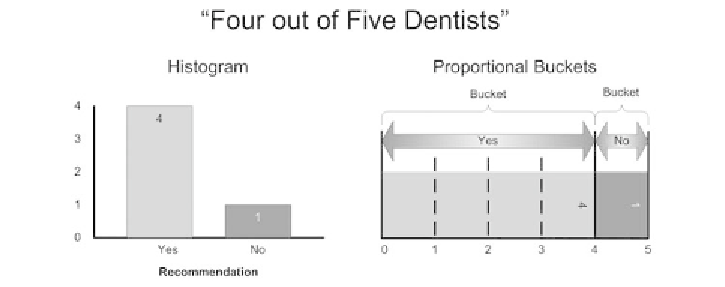
example, let's look at the histogram from Chapter 11. On the left side of Figure
12.1, we see the histogram representing the dentist data.
FIGURE 12.1
By laying the histogram bars end-to-end, we lay the results over
a number line. This allows us to mark the beginnings and ends of each range.
I don't mean to wander into pedantic territory here, but there is an aspect of
this histogram that we should make a note of. By the very nature of histograms, we
know that the “yes�? bar is four times the size of the “no�? bar. After all, another way
of expressing the recommendations of the dentists is “dentists recommend sugar-
less gum at a 4-to-1 ratio over gum with sugar in it.�? It logically follows that a rep-
resentation that measures ratios should be ratio-based in its portrayal. However,
these two vertical bars don't do us much good for randomly selecting which camp
our prospective dentist is in.