Game Development Reference
In-Depth Information
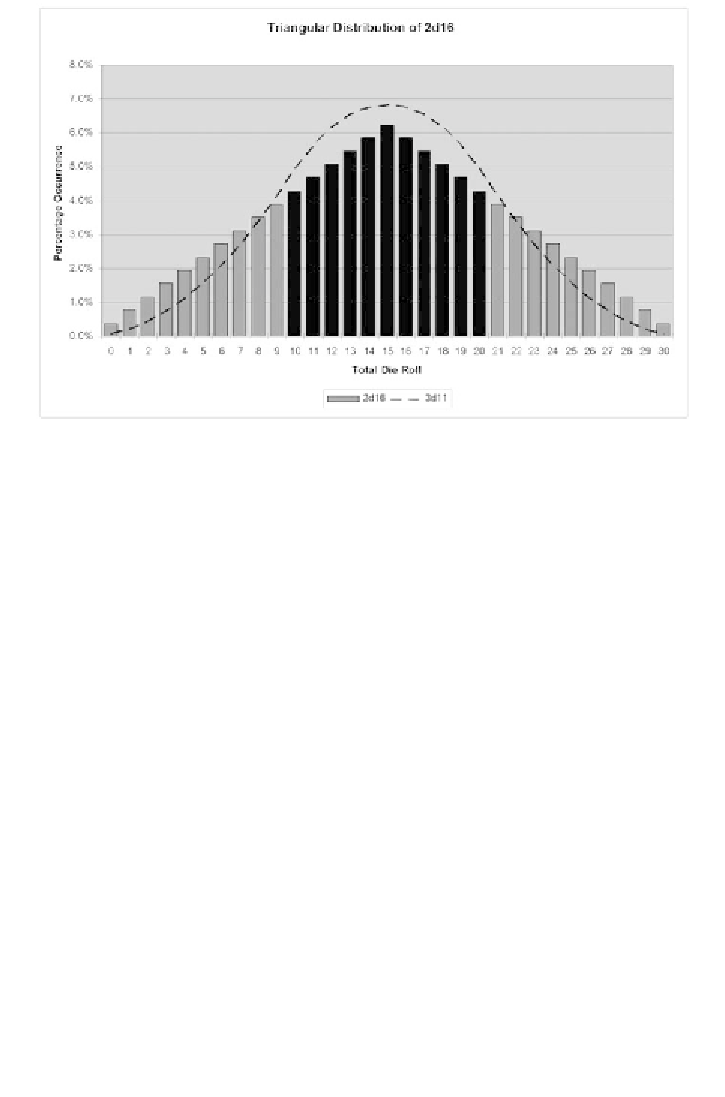
FIGURE 11.13
By using 2d16 to generate numbers between 0 and 30, our bell curve
becomes a triangular distribution. The range, mean, median, and mode are all the same
as the 3d11 distribution (dashed line). The standard deviation (black bars), however, is
slightly greater due to the slightly flatter spread of the population.
P
ARAMETRIC
B
UILDING
While the above is merely a simplification of the normal distribution, there is another
method that we can use to create triangular distributions that is enormously pow-
erful and flexible. By setting only three parameters, we can automatically generate
a continuous triangular distribution. The first two parameters are simply the upper
and lower bounds of the range. The third parameter is the peak of the triangle. We
can actually think of these three items as “worst case,�? “best case,�? and “likely case.�?
Looking at a sample triangular distribution in Figure 11.14, we can identify these
points.
If
a
and
c
are integers, then for any integer value
x
between the points
a
and
c
,
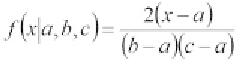
we can determine what the percentage of the total sample under the curve
x
is by
using one of the following formulas. The formula we use is based on whether the
value
x
is above or below
c.
The value of
x
must be within the range specified by
a
and
c
. Therefore, the actual deciding factors and their formulas are:
If
a
≤
≤
x
c
then: