Game Development Reference
In-Depth Information
Skewing the Curve
The two examples that we created above were similar in that they were symmetri-
cal. That is, the mean, median, and mode were all 15. If we wanted to generate a
probability distribution that did
not
have the bulk of the population in the middle,
we would have to take a slightly different approach.
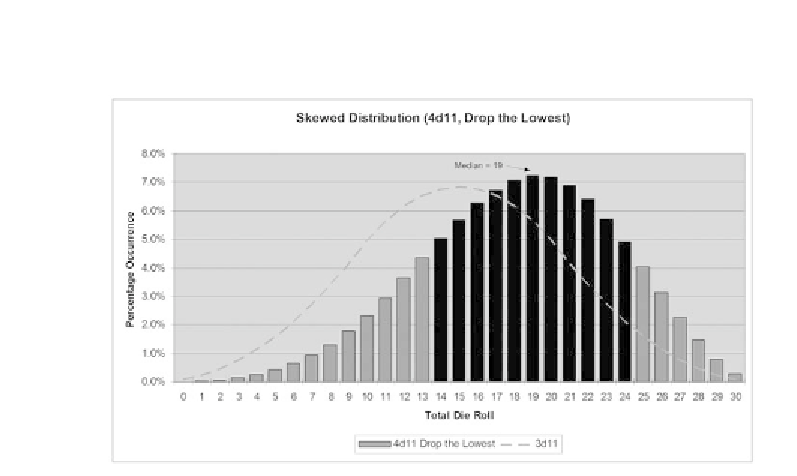
For example, instead of rolling 3d11, we could use 4d11 and, once rolled, drop
the lowest from consideration. We add the remaining three together just as if they
were the only three that we rolled. We can see the result in Figure 11.11. The median
of this curve is now 19 rather than 15. The standard deviation is almost the same as
it was with 3d11, but it has been
skewed
to the right by four places. Now, the first
standard deviation (68% of the possible outcomes) is in the range of 19 ± 5.2.
FIGURE 11.11
By rolling 4d11 and dropping the lowest die, we skew the
curve to the right (i.e., negative skew). Now, the higher results (around 19)
are more likely than the middle ones from the original (around 15).
The original 3d11 roll is shown by the dashed line.
Note that we could have skewed the curve in the opposite direction by drop-
ping the
highest
of the four dice rather than the lowest. Additionally, we could have
made the skew
more
pronounced (in either direction) by rolling five dice and drop-
ping two of them.
The last thing to note—something that has almost been forgotten in the shuffle
—is that these distributions have the same range… [0...30]. In all the cases, skewed
or not, we can legitimately claim that we are generating a random number between
0 and 30. This is important to remember. When faced with a situation that calls for
a random number between 0 and 30, we must ask ourselves the question, “How do
we want that distribution to look?�?