Game Development Reference
In-Depth Information
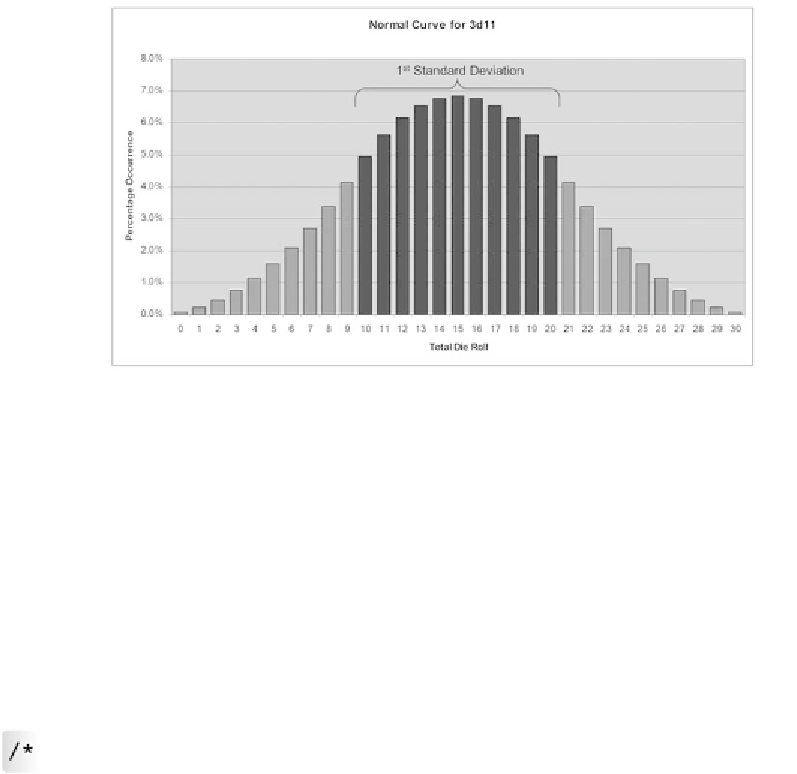
Another method would be to roll 3d11 (each of which allows the results 0 to
10). If we were to graph the probability distribution of this method (Figure 11.8),
we would see the familiar bell shape of a normal distribution. The median and
mean are both 15. Naturally, the mode is 15 as well, with 6.84% of the rolls adding
up to it (91 of 1,331 possible combinations).
FIGURE 11.8
This chart shows the random numbers from 0 to 30
that would be generated using the distribution 3d11. The standard
deviation of 5.48 means that the middle 11 selections ranging
from 10 to 20 (in black) encompass ≈ 68% of the possibilities.
The sample has a standard deviation of 5.48. That means that the data entries
±5.48 from the mean of 15 (e.g., 10 to 20) are in the first standard deviation.
Therefore, approximately 68% of the sample is between 10 and 20 inclusive.
P
UTTING
I
TIN
C
ODE
For convenience, the die-rolling code in this chapter is on the Web site at
http://www.courseptr.com/downloads.
It is contained in a single class,
CDie.
By inserting this class into your projects, you can use it to simulate a variety of
die-roll combinations.
We can create a simple function for generating normal distributions by first
creating one that parameterizes a die roll. For example, the following code block
simulates one die roll.