Game Development Reference
In-Depth Information
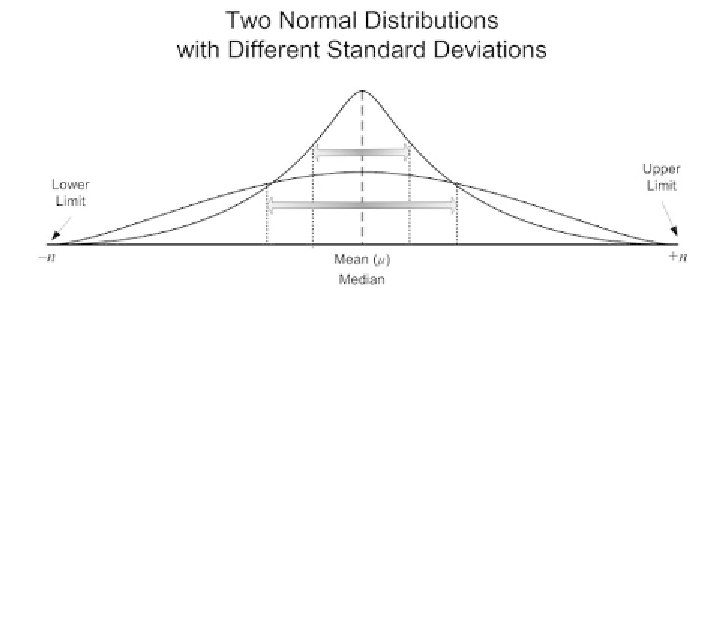
FIGURE 11.6
The standard deviation of a normal distribution determines the
characteristic of the population. A small standard deviation makes a narrower, higher bulk
of the population. A higher standard deviation leads to a broader, flatter curve.
G
ENERATING
N
ORMAL
D
ISTRIBUTIONS
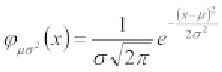
The formulas for generating true normal distributions are delightfully cryptic and
involved. The following formula, the Gaussian function, generates the continuous
probability density function of the normal distribution:
(sigma) is the standard deviation,
e
is our friendly
natural logarithmic constant (
≈
2.71828), and the parameter
In the above equation,
Σ
μ
(mu) is the
expected
value
… a fun little term used in statistics. And of course,
π
(pi) is, well…
pi.
All of
this squished together gives us a value for
(theta) that shows the density of the
curve at or around
x
. Now isn't
that
pleasant?
As you can see, dealing with this function is a little messy. Also, for the most part,
it doesn't do us a lot of good in the game development world. After all, we aren't
using these functions for analyzing existing data; we are trying to re-create data.
Certainly, if we knew the exact figures needed to model a population's behavior, we
could plug those into a normal distribution curve and churn out figures. These cal-
culations can be fairly processor-intensive, however—and processor time is not a
luxury producers often grant us AI folks in the trenches of game development.
Even more importantly, we aren't trying to model things exactly. There is a point
of diminishing returns where the minutia of hundredths of a percent gets lost in the
shuffle. Our job is to generate something
similar to
what it is we are trying to repli-
cate. Close enough for the effect but not so involved as to grind the process to a halt.
θ