Game Development Reference
In-Depth Information
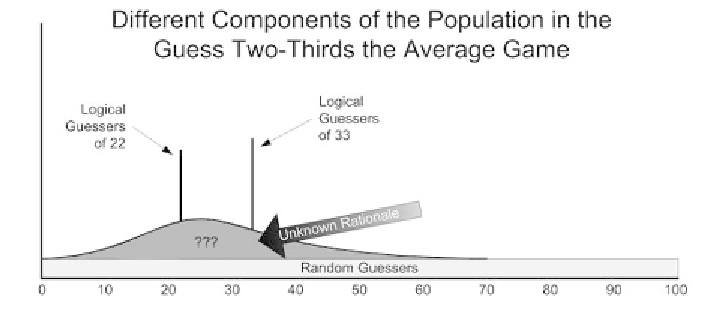
FIGURE 11.2
The Guess Two-Thirds Game had three types of participants: the random
guessers, the logical guessers, and a group of individuals who each had their own
methodology. Without knowing the rationale of each individual, we can still identify
where those people tended to guess and in what concentrations.
Glancing at the data from Chapter 6, we see that about 6.5% of the population
picked 33, and just over 6% guessed 22. However, we must take note that only
about half of those two populations stuck up “above the crowd.�? We would be rea-
sonable in making the assumption that only those people above the rest of the nearby
population
specifically
selected those numbers for a reason. The others selected 33
or 22 with as random a process of the people who selected 31, 34, 21, or 23. Let us
assume that 3% of the guessers selected 22 in a logical fashion, and 4% of the
guessers selected 33 in the same manner. That accounts for 7% of our population
total.
Second, we would have to model the random guessers. Likewise, this is a rela-
tively simple task. By determining the number of people who are guessing randomly,
we can then spread them evenly across the entire range of possibilities by simply
selecting a random number from 0 to 100. For example, we could say that 30% of
the population guessed randomly. Evenly spread, this would mean about 0.3%
would pick each of the 101 possibilities from 0 to 100.
The third task is slightly more involved and certainly less definable. We would
have to come up with a method of representing the 63% of the players who weren't
random
, but weren't
logically
calculating. Because we
can't
model the very personal,
unique thought processes that went on in each person's mind, we have to look at
them as an aggregate. Using the terminology from descriptive decision theory,
“What do people tend to do?�?