Game Development Reference
In-Depth Information
No Attack:
10%
Small Attack:
50%
Large Attack:
40%
Next, let's assume that with a tower present, the probabilities change to the
following:
No Attack:
50%
Small Attack:
10%
Large Attack:
40%
The differences in the above figures represent what would likely be reluctance
on the part of the enemy to attack a protected barracks with a small force—perhaps
electing instead to only attack when it can commit the larger force that would be
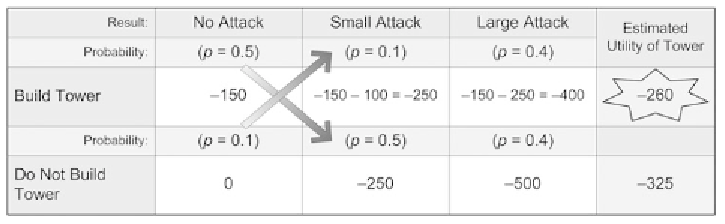
necessary. The resulting figures are shown in Figure 7.9.
FIGURE 7.9
By including the idea that the presence of the tower may discourage
attack, we must change the probability numbers—which, in turn, change the way the
utility costs are applied.
Note that to visualize this new wrinkle, we need to change the way we are laying
out our table. Before, we were putting the likelihood of attack at the top of each col-
umn. Now, these figures change based on the row as well. For clarity, I have broken
the table into two parts—one for building the tower and one for not building it.
If we calculate the utility of
not
building the tower (
E
(¬
T
)) using the probabil-
ities that we have in place for building it (i.e., 50%, 10%, 40%), the resulting utility
is -225. The utility of building the tower (
E
(
T
)) is -260.
E
(¬
T
) >
E
(
T
). Therefore,
the utility of
not
building it is greater—that is, it would not be worth it to build.
However, once we adjust for our “deterrent factor,�? the utility of
not
building
the tower (
E
(¬
T
)) becomes -325. That means
E
(
T
) >
E
(¬
T
). Without changing any