Environmental Engineering Reference
In-Depth Information
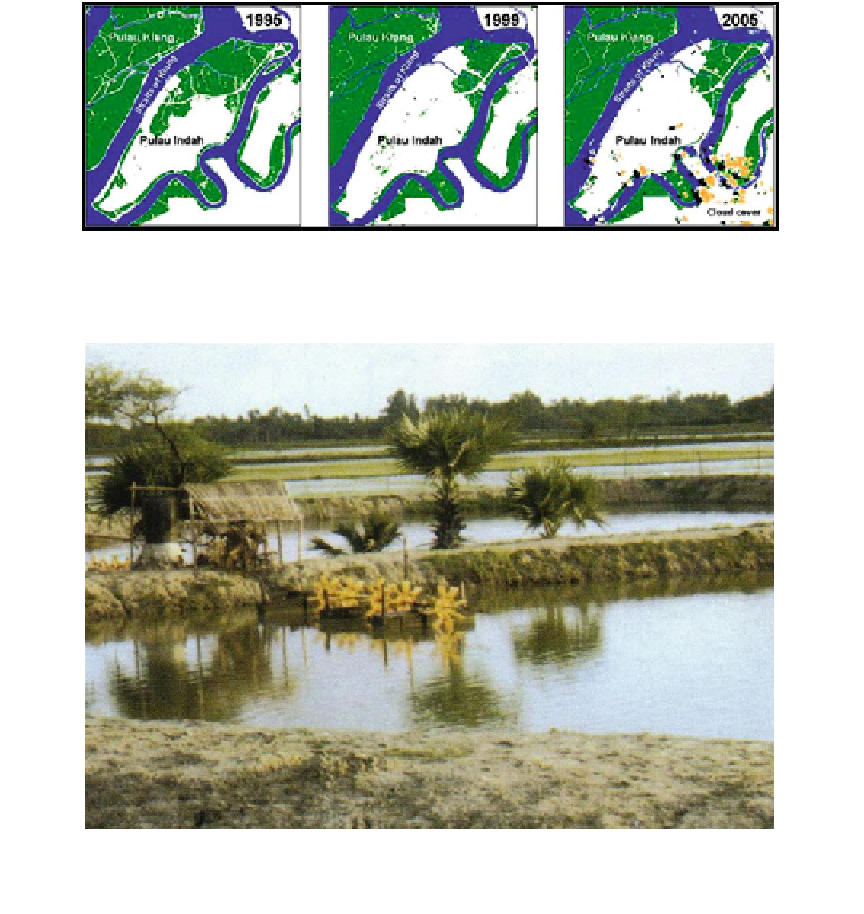
Fig. 7.32
Decline of mangrove forests in Pulau Indah, Malaysia. Area in dark green represents mangrove forests
(Ahmad and Suratman
2007
)
Fig. 7.33
Shrimp culture ponds in mangrove patches:
a common scene in tropical mangrove ecosystem; pho-
tograph taken on 4 December 2013 by Mr. Tanmay Ray
Chaudhuri (Environmentalist and a researcher of Techno
India University, Kolkata)
In the most recent study, Ahmad and Surat-
man (
2007
) conducted a change detection anal-
ysis of mangrove forests utilizing a time series of
Landsat TM imagery in Pulau Indah (literally
translated means
respectively. The higher declining rate during the
rst interval was primarily due to expansion and
land development for building seaport infra-
structures on this island. The estimated reduction
rate of mangrove forests for the 10-year period
was 1.6 % per year, which is slightly higher that
reported nationally by Ong (
1982
) over the past
20 years (i.e. 1 % per year).
In many countries, the coastal area is exploi-
ted for procuring salt from the sea water. About
30 % of world
) and its
vicinity, Malaysia. This analysis was focused on
determining mangrove reduction rates and iden-
tifying their spatial patterns within two interval
periods, 1995
'
Beautiful
Island
'
2005 (Fig.
7.32
).
Results from the analysis suggested there has
been a decline in mangrove forests during both
intervals at
-
1999 and 1999
-
'
s supply of salt comes from sea
water. In order to keep the cost of production
the rates of 14.1 and 1.9 %,