Environmental Engineering Reference
In-Depth Information
Table 7.4
Variations of hydrological parameters in different phases before, during and after AILA
Stations
Surface water
salinity (Phase
A)
Surface water
salinity (Phase
B)
Surface water
salinity (Phase
C)
pH
(Phase
A)
pH
(Phase
B)
pH
(Phase
C)
D.O
(Phase
A)
D.O
(Phase
B)
D.O
(Phase
C)
Stn. 1
3.41
3.99
3.45
7.65
7.65
7.65
5.71
4.98
5.23
Stn. 2
4.88
5.93
4.96
7.68
7.69
7.68
5.43
5.00
5.21
Stn. 3
6.10
7.53
6.18
7.70
7.70
7.70
6.63
6.03
6.50
Stn. 4
13.17
16.32
13.98
8.00
8.00
8.00
6.55
5.89
6.11
Stn. 5
12.05
14.95
12.78
8.10
8.11
8.10
4.80
4.74
5.31
Stn. 6
13.84
17.23
14.01
8.00
8.03
8.01
4.91
4.67
5.12
Stn. 7
15.55
19.40
15.98
8.10
8.11
8.11
4.80
4.65
5.32
Stn. 8
14.43
18.04
14.87
8.10
8.12
8.11
4.75
4.43
5.02
Stn. 9
17.22
21.58
17.96
8.10
8.11
8.11
4.60
4.54
5.99
Stn. 10
19.33
24.30
20.05
8.15
8.15
8.16
4.68
4.60
5.06
Stn. 11
20.58
25.93
21.00
8.20
8.21
8.21
5.05
4.99
5.19
Stn. 12
23.08
29.77
24.67
8.20
8.21
8.21
5.02
4.91
5.27
Phase A pre-AILA period (18 May 2009), Phase B AILA phase (27 May 2009), Phase C post-AILA phase (4 June 2009)
Units of surface water salinity and DO are psu and ppm, respectively
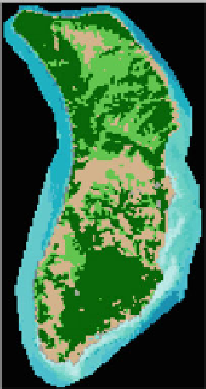
MANGROVE VEGETATION = 2527 ha
MANGROVE VEGETATION = 2614 ha
TOTAL ISLAND AREA = 3356 ha
TOTAL ISLAND AREA = 3247 ha
PRE AILA PHASE
POST AILA PHASE
PERIOD OF IMAGERY: DEC 2008
PERIOD OF IMAGERY: JAN 2010
Fig. 7.12
Lothian Island
nine islands in Indian Sundarbans have changed
signi
F.4.1. Sandy and Blue Carbon
In terms of extreme weather events, the
year 2012 will most likely be remembered for the
occurrence of Hurricane Sandy in October 2012,
which made headlines for several days on end in
the media around the world, amounting to
cantly between years (Table
7.5
).
The signi
cant change in land area between
years (
< 0.01) may be the effect of erosion or
sea level rise caused by actual increase of sea
level and/or subsidence of deltaic region.
p