Environmental Engineering Reference
In-Depth Information
50
45
40
35
30
25
20
Western sector
Cen tral s ecto r
Eastern sector
15
10
5
0
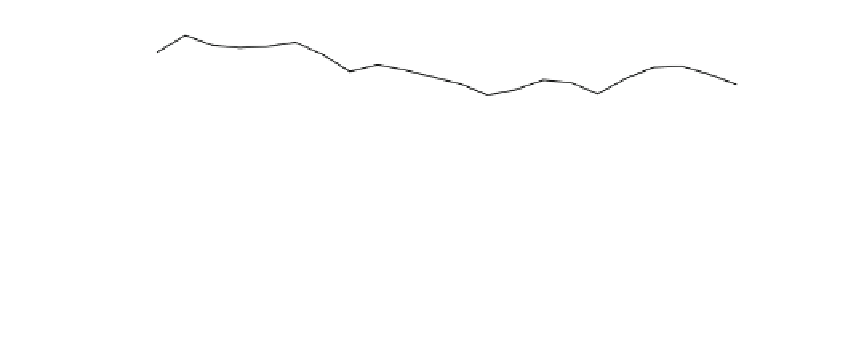
Fig. 6.8
Decreasing trend of oyster shell weight in Indian Sundarbans: is this a signature of marine and estuarine
acidi
cation?
store it as carbon in their vegetative and repro-
ductive parts through active participation of the
enzyme ribulose-1, 5-biphosphate carboxylase/
oxygenase (RuBisco).
The decrease in aquatic pH has been found to
exert an adverse impact on shelled organisms. It
results in the reduction of the shell weight in
oyster species
Table
6.1
), where few estuaries like Matla has
basically lost its physico-chemical nature in the
absence of mixing freshwater from the upstream
sources. Instead of considering Matla as an
estuary, it may be designated as tide-fed river.
Oyster shell being a storehouse of carbon also
exhibits signi
cant positive correlations with
aquatic pH in western and eastern sectors of
Indian Sundarbans (Table
6.1
), but when allo-
metric equation interlinking the two variables is
formed, the signi
Saccostrea cucullata
as evidenced
by the authors (Fig.
6.8
).
The population of oyster is not affected by
aquatic pH, but the shell weight is greatly
affected by pH. Lowering of pH may cause dis-
solution of calcareous mass of the shell leading
to its thinning, which is re
cant positive interrelationship
is diluted as evidenced from the
2
value in
Fig.
6.13
. This may again be attributed to the
inclusion of central sector in the data set (used
for Fig.
6.13
), where the correlation between
oyster shell carbon and aquatic pH is insigni
R
fl
ected through highly
signi
cant positive correlation between the oys-
ter shell weight and pH of the ambient water in
all the three sectors (except the central sector) of
Indian Sundarbans. The degree of positive cor-
relation is masked to a great extent by the results
of central
-
cant (Table
6.1
). The central sector of Indian
Sundarbans is hypersaline, compared to the
western and central Indian Sundarbans
(Figs.
6.10
,
6.11
and
6.12
) (Mitra et al.
2009
,
Indian Sundarbans (Fig.
6.9
and
50
40
30
y = 0.0047e
1.0761x
R
2
= 0.1042
20
10
0
8.20
8.22
8.24
8.26
8.28
8.30
8.32
8.34
Aquatic pH
Fig. 6.9
Interrelationship between oyster shell weight and aquatic pH considering all the three sectors of Indian
Sundarbans


