Environmental Engineering Reference
In-Depth Information
Table 1.2
Sampling stations in the western, central and eastern sectors of Indian Sundarbans in the lower Gangetic
delta region
Sectors
Sampling stations
Latitude
Longitude
Western sector
Stn. 1
Chemaguri (W
1
)
21
°
38
′
25.86
″
N
88
°
08
′
53.55
″
E
21
°
40
′
02.33
″
N
88
°
23
′
27.18
″
E
Stn. 2
Saptamukhi (W
2
)
Stn. 3
Jambu Island (W
3
)
21
°
35
′
42.03
″
N
88
°
10
′
22.76
″
E
Stn. 4
Lothian (W
4
)
21
°
38
′
21.20
″
N
88
°
20
′
29.32
″
E
Stn. 5
Harinbari (W
5
)
21
°
44
′
22.55
″
N
88
°
04
′
32.97
″
E
Stn. 6
Prentice Island (W
6
)
21
°
42
′
47.88
″
N
88
°
17
′
55.05
″
E
Central sector
Stn. 7
Thakuran Char (C
1
)
21
°
49
′
53.17
″
N
88
°
31
′
25.57
″
E
Stn. 8
Dhulibasani (C
2
)
21
°
47
′
06.62
″
N
88
°
33
′
48.20
″
E
Stn. 9
Chulkathi (C
3
)
21
°
41
′
53.62
″
N
88
°
34
′
10.31
″
E
Stn. 10
Goashaba (C
4
)
21
°
43
′
50.64
″
N
88
°
46
′
41.44
″
E
Stn. 11
Matla (C
5
)
21
°
53
′
15.30
″
N
88
°
44
′
08.74
″
E
Stn. 12
Pirkhali (C
6
)
22
°
06
′
00.97
″
N
88
°
51
′
06.04
″
E
Eastern sector
Stn. 13
Arbesi (E
1
)
22
°
11
′
43.14
″
N
89
°
01
′
09.04
″
E
22
°
09
′
51.53
″
N
88
°
57
′
57.07
″
E
Stn. 14
Jhilla (E
2
)
Stn. 15
Harinbhanga (E
3
)
21
°
57
′
17.85
″
N
88
°
59
′
33.24
″
E
Stn. 16
Khatuajhuri (E
4
)
22
°
03
′
06.55
″
N
89
°
01
′
05.33
″
E
Stn. 17
Chamta (E
5
)
21
°
53
′
18.56
″
N
88
°
57
′
11.40
″
E
Stn. 18
Chandkhali (E
6
)
21
°
51
′
13.59
″
N
89
°
00
′
44.68
″
E
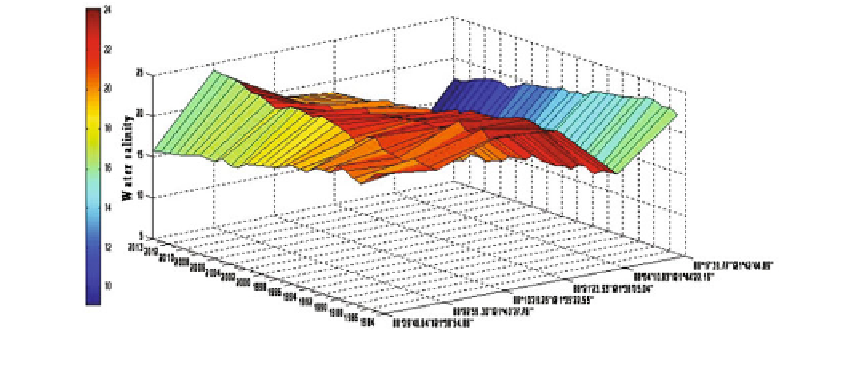
Fig. 1.7
Spatio-temporal variation of salinity in western Indian Sundarbans
salinity increase in this sector ranges from
31.49 psu (in Chulkathi) to 33.64 psu (in Matla)
with an average of increase 32.62 % over a period
of 30 years (Fig.
1.9
).
Considering the observed data set of 30 years
(1984
which is an indication of alarming hypersaline
condition (a rise by 67.1 %) in 2043 in this sector.
In the eastern sector, salinity has decreased
(Fig.
1.11
), which ranges from 0.54 psu/year (in
Chamta) to 0.98 psu/year (in Jhilla). Considering
all the six stations in eastern Indian Sundarbans,
the average decrease of salinity is 0.86 psu/year,
equivalent to a decadal decrease of 10.30 psu.
2013), we predict that salinity will be
around 36 psu after a period of 30 years in the
central sector of Indian Sundarbans (Fig.
1.10
),
-